Travelers 2005 Annual Report Download - page 210
Download and view the complete annual report
Please find page 210 of the 2005 Travelers annual report below. You can navigate through the pages in the report by either clicking on the pages listed below, or by using the keyword search tool below to find specific information within the annual report.-
 1
1 -
2
-
3
-
4
-
5
-
6
-
7
-
8
-
9
-
10
-
11
-
12
-
13
-
14
-
15
-
16
-
17
-
18
-
19
-
20
-
21
-
22
-
23
-
24
-
25
-
26
-
27
-
28
-
29
-
30
-
31
-
32
-
33
-
34
-
35
-
36
-
37
-
38
-
39
-
40
-
41
-
42
-
43
-
44
-
45
-
46
-
47
-
48
-
49
-
50
-
51
-
52
-
53
-
54
-
55
-
56
-
57
-
58
-
59
-
60
-
61
-
62
-
63
-
64
-
65
-
66
-
67
-
68
-
69
-
70
-
71
-
72
-
73
-
74
-
75
-
76
-
77
-
78
-
79
-
80
-
81
-
82
-
83
-
84
-
85
-
86
-
87
-
88
-
89
-
90
-
91
-
92
-
93
-
94
-
95
-
96
-
97
-
98
-
99
-
100
-
101
-
102
-
103
-
104
-
105
-
106
-
107
-
108
-
109
-
110
-
111
-
112
-
113
-
114
-
115
-
116
-
117
-
118
-
119
-
120
-
121
-
122
-
123
-
124
-
125
-
126
-
127
-
128
-
129
-
130
-
131
-
132
-
133
-
134
-
135
-
136
-
137
-
138
-
139
-
140
-
141
-
142
-
143
-
144
-
145
-
146
-
147
-
148
-
149
-
150
-
151
-
152
-
153
-
154
-
155
-
156
-
157
-
158
-
159
-
160
-
161
-
162
-
163
-
164
-
165
-
166
-
167
-
168
-
169
-
170
-
171
-
172
-
173
-
174
-
175
-
176
-
177
-
178
-
179
-
180
-
181
-
182
-
183
-
184
-
185
-
186
-
187
-
188
-
189
-
190
-
191
-
192
-
193
-
194
-
195
-
196
-
197
-
198
-
199
-
 200
200 -
 201
201 -
 202
202 -
 203
203 -
 204
204 -
 205
205 -
 206
206 -
 207
207 -
 208
208 -
 209
209 -
 210
210 -
 211
211 -
 212
212 -
 213
213 -
 214
214 -
 215
215 -
 216
216 -
 217
217 -
 218
218 -
 219
219 -
 220
220 -
221
-
222
-
223
-
224
-
225
-
226
-
227
-
228
-
229
-
230
-
231
-
232
-
233
-
234
-
235
-
236
-
237
-
238
-
239
-
240
-
241
-
242
-
243
-
244
-
245
-
246
-
247
-
248
-
249
-
250
-
251
-
252
-
253
-
254
-
255
-
256
-
257
-
258
 |
 |
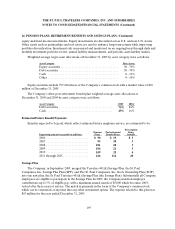
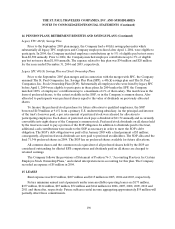
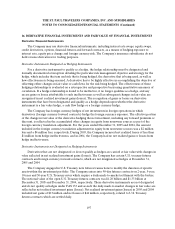
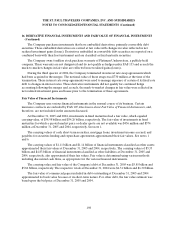
THE ST. PAUL TRAVELERS COMPANIES, INC.AND SUBSIDIARIES
NOTES TO CONSOLIDATED FINANCIAL STATEMENTS (Continued)
198
16. DERIVATIVE FINANCIAL INSTRUMENTS AND FAIRVALUE OF FINANCIAL INSTRUMENTS
(Continued)
The Company purchases investments that have embedded derivatives, primarily convertible debt
securities. These embedded derivatives are carried at fair value with changes in value reflected in net
realized investment gains (losses). Derivatives embedded in convertible debt securities are reported on a
combined basis with their host instrument and are classified as fixed maturity securities.
The Company owns 6 million stock purchase warrants of Platinum Underwriters, a publicly-held
company. These warrants are not designated and do not qualify as hedges under FAS 133 and as such the
mark-to-market changes in fair value are reflected in net realized gains (losses).
During the third quarter of 2004, the Company terminated its interest rate swap agreements which
had been acquired in the merger. The notional value of these swaps was $730 million at the time of the
termination. These interest rate swap agreements were used to manage exposure of certain of its fixed rate
debt to changes in interest rates. These derivative instruments did not qualify for continued hedge
accounting following the merger and, as such, the mark-to-market changes in fair value were reflected in
net realized investment gains and losses prior to the termination of these agreements.
Fair Value of Financial Instruments
The Company uses various financial instruments in the normal course of its business. Certain
insurance contracts are excluded by FAS 107, Disclosures about Fair Value of Financial Instruments , and,
therefore, are not included in the amounts discussed.
At December 31, 2005 and 2004, investments in fixed maturities had a fair value, which equaled
carrying value, of $58.98 billion and $54.26 billion, respectively. The fair value of investments in fixed
maturities for which a quoted market price or dealer quote are not available was $456 million and $574
million at December 31, 2005 and 2004, respectively. See note 1.
The carrying values of cash, short-term securities, mortgage loans, investment income accrued, and
payables for securities lending and repurchase agreements approximated their fair values. See notes 1
and 6.
The carrying values of $1.11 billion and $1.14 billion of financial instruments classified as other assets
approximated their fair values at December 31, 2005 and 2004, respectively. The carrying values of $5.33
billion and $4.83 billion of financial instruments classified as other liabilities at December 31, 2005 and
2004, respectively, also approximated their fair values. Fair value is determined using various methods
including discounted cash flows, as appropriate for the various financial instruments.
The carrying value and fair value of the Company’s debt at December 31, 2005 was $5.85 billion and
$5.82 billion, respectively. The respective totals at December 31, 2004 were $6.31 billion and $6.30 billion.
The fair value of commercial paper included in debt outstanding at December 31, 2005 and 2004
approximated its book value because of its short-term nature. For other debt, the fair value estimate was
based upon the bid price at December 31, 2005 and 2004.