Travelers 2005 Annual Report Download - page 175
Download and view the complete annual report
Please find page 175 of the 2005 Travelers annual report below. You can navigate through the pages in the report by either clicking on the pages listed below, or by using the keyword search tool below to find specific information within the annual report.-
 1
1 -
2
-
3
-
4
-
5
-
6
-
7
-
8
-
9
-
10
-
11
-
12
-
13
-
14
-
15
-
16
-
17
-
18
-
19
-
20
-
21
-
22
-
23
-
24
-
25
-
26
-
27
-
28
-
29
-
30
-
31
-
32
-
33
-
34
-
35
-
36
-
37
-
38
-
39
-
40
-
41
-
42
-
43
-
44
-
45
-
46
-
47
-
48
-
49
-
50
-
51
-
52
-
53
-
54
-
55
-
56
-
57
-
58
-
59
-
60
-
61
-
62
-
63
-
64
-
65
-
66
-
67
-
68
-
69
-
70
-
71
-
72
-
73
-
74
-
75
-
76
-
77
-
78
-
79
-
80
-
81
-
82
-
83
-
84
-
85
-
86
-
87
-
88
-
89
-
90
-
91
-
92
-
93
-
94
-
95
-
96
-
97
-
98
-
99
-
100
-
101
-
102
-
103
-
104
-
105
-
106
-
107
-
108
-
109
-
110
-
111
-
112
-
113
-
114
-
115
-
116
-
117
-
118
-
119
-
120
-
121
-
122
-
123
-
124
-
125
-
126
-
127
-
128
-
129
-
130
-
131
-
132
-
133
-
134
-
135
-
136
-
137
-
138
-
139
-
140
-
141
-
142
-
143
-
144
-
145
-
146
-
147
-
148
-
149
-
150
-
151
-
152
-
153
-
154
-
155
-
156
-
157
-
158
-
159
-
160
-
161
-
162
-
163
-
164
-
 165
165 -
 166
166 -
 167
167 -
 168
168 -
 169
169 -
 170
170 -
 171
171 -
 172
172 -
 173
173 -
 174
174 -
 175
175 -
 176
176 -
 177
177 -
 178
178 -
 179
179 -
 180
180 -
 181
181 -
 182
182 -
 183
183 -
 184
184 -
 185
185 -
186
-
187
-
188
-
189
-
190
-
191
-
192
-
193
-
194
-
195
-
196
-
197
-
198
-
199
-
200
-
201
-
202
-
203
-
204
-
205
-
206
-
207
-
208
-
209
-
210
-
211
-
212
-
213
-
214
-
215
-
216
-
217
-
218
-
219
-
220
-
221
-
222
-
223
-
224
-
225
-
226
-
227
-
228
-
229
-
230
-
231
-
232
-
233
-
234
-
235
-
236
-
237
-
238
-
239
-
240
-
241
-
242
-
243
-
244
-
245
-
246
-
247
-
248
-
249
-
250
-
251
-
252
-
253
-
254
-
255
-
256
-
257
-
258
 |
 |

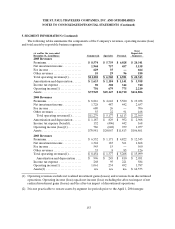
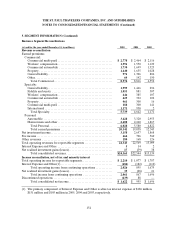
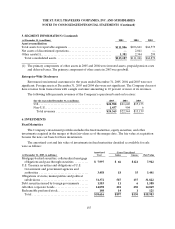
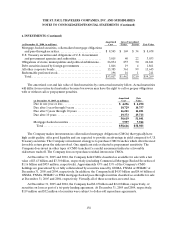
THE ST. PAUL TRAVELERS COMPANIES, INC.AND SUBSIDIARIES
NOTES TO CONSOLIDATED FINANCIAL STATEMENTS (Continued)
163
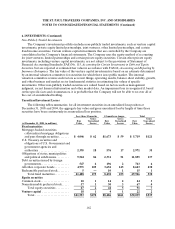
6. INVESTMENTS (Continued)
Less than12 months 12 months or longer Total
(at December 31, 2004, in millions)
Fair
Value
Gross
Unrealized
Losses
Fair
Value
Gross
Unrealized
Losses
Fair
Value
Gross
Unrealized
Losses
Fixed maturities
Mortgage-backed securities,
collateralized mortgage obligations
andpassthrough securities ......... $3,256$33 $30 $1 $3,286 $ 34
U.S. Treasury securities and obligations
of U.S. Government and government
agencies andauthorities............ 1,743 22 4— 1,747 22
Obligations of states, municipalities and
political subdivisions............... 5,708 49 641 5,772 50
Debt securities issued by foreign
governments. ..................... 726 46— 732 4
All other corporate bonds ............ 6,190 95 2474 6,437 99
Redeemable preferredstock .......... 8—12 120 1
Total fixed maturities ............ 17,631 203 363 7 17,994 210
Equity securities
Commonstock...................... 25111 26 2
Nonredeemable preferred stock. ...... 89 317— 106 3
Total equity securities ........... 114418 1132 5
Venture capital..................... 5318— — 53 18
Total.......................... $17,798 $ 225 $ 381$ 8 $ 18,179 $ 2 33
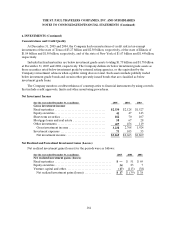
Impairment charges included in net realized investment gains (losses) were as follows:
(for the year ended December 31, in millions) 2005 2004 2003
Fixed maturities ......................................... $ 11$25 $65
Equity securities ......................................... —5 6
Venture capital.......................................... 8040 —
Real estate and other. .................................... 1810 19
Total................................................. $ 1 09 $80 $90
Mortgage Loans
Aggregate annual maturities on mortgage loans are $42 million, $5 million, $9 million, $2 million, and
$87million for 2006, 2007, 2008, 2009 and 2010 and thereafter, respectively.
Underperforming mortgage loans, which include delinquent loans, loans in the process of foreclosure
and loans modified at interest rates below market, were $0 and $4 million at December 31, 2005 and 2004,
respectively.