Travelers 2005 Annual Report Download - page 165
Download and view the complete annual report
Please find page 165 of the 2005 Travelers annual report below. You can navigate through the pages in the report by either clicking on the pages listed below, or by using the keyword search tool below to find specific information within the annual report.-
 1
1 -
2
-
3
-
4
-
5
-
6
-
7
-
8
-
9
-
10
-
11
-
12
-
13
-
14
-
15
-
16
-
17
-
18
-
19
-
20
-
21
-
22
-
23
-
24
-
25
-
26
-
27
-
28
-
29
-
30
-
31
-
32
-
33
-
34
-
35
-
36
-
37
-
38
-
39
-
40
-
41
-
42
-
43
-
44
-
45
-
46
-
47
-
48
-
49
-
50
-
51
-
52
-
53
-
54
-
55
-
56
-
57
-
58
-
59
-
60
-
61
-
62
-
63
-
64
-
65
-
66
-
67
-
68
-
69
-
70
-
71
-
72
-
73
-
74
-
75
-
76
-
77
-
78
-
79
-
80
-
81
-
82
-
83
-
84
-
85
-
86
-
87
-
88
-
89
-
90
-
91
-
92
-
93
-
94
-
95
-
96
-
97
-
98
-
99
-
100
-
101
-
102
-
103
-
104
-
105
-
106
-
107
-
108
-
109
-
110
-
111
-
112
-
113
-
114
-
115
-
116
-
117
-
118
-
119
-
120
-
121
-
122
-
123
-
124
-
125
-
126
-
127
-
128
-
129
-
130
-
131
-
132
-
133
-
134
-
135
-
136
-
137
-
138
-
139
-
140
-
141
-
142
-
143
-
144
-
145
-
146
-
147
-
148
-
149
-
150
-
151
-
152
-
153
-
154
-
 155
155 -
 156
156 -
 157
157 -
 158
158 -
 159
159 -
 160
160 -
 161
161 -
 162
162 -
 163
163 -
 164
164 -
 165
165 -
 166
166 -
 167
167 -
 168
168 -
 169
169 -
 170
170 -
 171
171 -
 172
172 -
 173
173 -
 174
174 -
 175
175 -
176
-
177
-
178
-
179
-
180
-
181
-
182
-
183
-
184
-
185
-
186
-
187
-
188
-
189
-
190
-
191
-
192
-
193
-
194
-
195
-
196
-
197
-
198
-
199
-
200
-
201
-
202
-
203
-
204
-
205
-
206
-
207
-
208
-
209
-
210
-
211
-
212
-
213
-
214
-
215
-
216
-
217
-
218
-
219
-
220
-
221
-
222
-
223
-
224
-
225
-
226
-
227
-
228
-
229
-
230
-
231
-
232
-
233
-
234
-
235
-
236
-
237
-
238
-
239
-
240
-
241
-
242
-
243
-
244
-
245
-
246
-
247
-
248
-
249
-
250
-
251
-
252
-
253
-
254
-
255
-
256
-
257
-
258
 |
 |

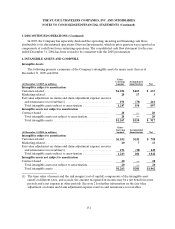
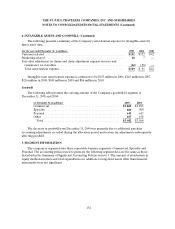
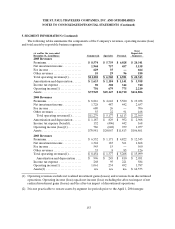
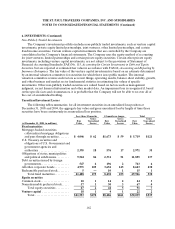
THE ST. PAUL TRAVELERS COMPANIES, INC.AND SUBSIDIARIES
NOTES TO CONSOLIDATED FINANCIAL STATEMENTS (Continued)
153
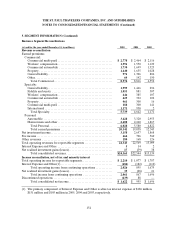
5. SEGMENT INFORMATION (Continued)
The following tables summarize the components of the Company’s revenues, operating income (loss)
and total assets by reportable business segments:
(at and for the year ended
December 31, in millions) Commercial Specialty Personal
Total
Reportable
Segments
2005 Revenues
Premiums ......................... $8,574 $ 5,739 $ 6,028$ 20,341
Net investment income............. 1,944 757 457 3,158
Fee income ....................... 629 35— 664
Other revenues .................... 55 29 96 180
Total operating revenues(1)......... $ 1 1,202 $ 6,560 $ 6,581$ 24,343
Amortization and depreciation ...... $1,633 $1,184 $1,141 $3,958
Income tax expense ................ 90 308 342 740
Operating income(1) ............... 756 679 775 2,210
Assets ............................ $ 7 3,949 $ 25,147 $ 12,710 $ 111,806
2004 Revenues
Premiums ......................... $ 8,816$ 4,642 $ 5,580$ 19,038
Net investment income ............. 1,728487 4422,657
Feeincome....................... 68026— 706
Otherrevenues .................... 55 22 91 168
Total operating revenues(1)....... $11,279 $5,177 $6,113 $22,569
Amortization anddepreciation...... $1,187 $ 829 $952 $2,968
Income tax expense (benefit)........ 132(406) 442168
Operating income (loss)(1). ......... 786(648) 9391,077
Assets ............................ $ 70,981 $ 24,067 $ 11,813 $ 1 06,861
2003 Revenues
Premiums ......................... $ 6,552$ 1,171 $ 4,822$ 12,545
Net investment income ............. 1,324183 3611,868
Feeincome....................... 54515— 560
Otherrevenues .................... 33 885126
Totaloperating revenues(1)......... $ 8,454$ 1,377 $ 5,268$ 15,099
Amortization anddepreciation.... $ 996$ 245 $ 810$2,051
Income tax expense ................ 26895221 584
Operating income(1)............... 1,061 234 4921,787
Assets(2)......................... n/a n/a n/a$64,573
(1) Operating revenues exclude net realized investment gains (losses) and revenues from discontinued
operations. Operating income (loss) equals net income (loss) excluding the after-tax impact of net
realized investment gains (losses) and the after-tax impact of discontinued operations.
(2) It is not practicable to restate assets by segment for periods prior to the April 1, 2004 merger.