Travelers 2005 Annual Report Download - page 167
Download and view the complete annual report
Please find page 167 of the 2005 Travelers annual report below. You can navigate through the pages in the report by either clicking on the pages listed below, or by using the keyword search tool below to find specific information within the annual report.-
 1
1 -
2
-
3
-
4
-
5
-
6
-
7
-
8
-
9
-
10
-
11
-
12
-
13
-
14
-
15
-
16
-
17
-
18
-
19
-
20
-
21
-
22
-
23
-
24
-
25
-
26
-
27
-
28
-
29
-
30
-
31
-
32
-
33
-
34
-
35
-
36
-
37
-
38
-
39
-
40
-
41
-
42
-
43
-
44
-
45
-
46
-
47
-
48
-
49
-
50
-
51
-
52
-
53
-
54
-
55
-
56
-
57
-
58
-
59
-
60
-
61
-
62
-
63
-
64
-
65
-
66
-
67
-
68
-
69
-
70
-
71
-
72
-
73
-
74
-
75
-
76
-
77
-
78
-
79
-
80
-
81
-
82
-
83
-
84
-
85
-
86
-
87
-
88
-
89
-
90
-
91
-
92
-
93
-
94
-
95
-
96
-
97
-
98
-
99
-
100
-
101
-
102
-
103
-
104
-
105
-
106
-
107
-
108
-
109
-
110
-
111
-
112
-
113
-
114
-
115
-
116
-
117
-
118
-
119
-
120
-
121
-
122
-
123
-
124
-
125
-
126
-
127
-
128
-
129
-
130
-
131
-
132
-
133
-
134
-
135
-
136
-
137
-
138
-
139
-
140
-
141
-
142
-
143
-
144
-
145
-
146
-
147
-
148
-
149
-
150
-
151
-
152
-
153
-
154
-
155
-
156
-
 157
157 -
 158
158 -
 159
159 -
 160
160 -
 161
161 -
 162
162 -
 163
163 -
 164
164 -
 165
165 -
 166
166 -
 167
167 -
 168
168 -
 169
169 -
 170
170 -
 171
171 -
 172
172 -
 173
173 -
 174
174 -
 175
175 -
 176
176 -
 177
177 -
178
-
179
-
180
-
181
-
182
-
183
-
184
-
185
-
186
-
187
-
188
-
189
-
190
-
191
-
192
-
193
-
194
-
195
-
196
-
197
-
198
-
199
-
200
-
201
-
202
-
203
-
204
-
205
-
206
-
207
-
208
-
209
-
210
-
211
-
212
-
213
-
214
-
215
-
216
-
217
-
218
-
219
-
220
-
221
-
222
-
223
-
224
-
225
-
226
-
227
-
228
-
229
-
230
-
231
-
232
-
233
-
234
-
235
-
236
-
237
-
238
-
239
-
240
-
241
-
242
-
243
-
244
-
245
-
246
-
247
-
248
-
249
-
250
-
251
-
252
-
253
-
254
-
255
-
256
-
257
-
258
 |
 |

THE ST. PAUL TRAVELERS COMPANIES, INC.AND SUBSIDIARIES
NOTES TO CONSOLIDATED FINANCIAL STATEMENTS (Continued)
155
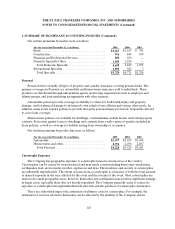
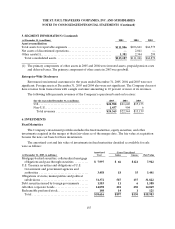
5. SEGMENT INFORMATION (Continued)
(at December 31,inmillions) 2005 2004 2003
Asset reconciliation
Total assets for reportable segments ............................... $111,806
$106,861 $64,573
Net assets ofdiscontinued operations .............................. —2,041 —
Other assets(1). ................................................. 1,381 2,344 299
Total consolidated assets ....................................... $113,187
$111,246 $64,872
(1) The primary components of other assets in 2005 and 2004 were invested assets, prepaid pension costs
and deferred taxes. The primary component of other assets in 2003 was goodwill.
Enterprise-Wide Disclosures
Revenues from internal customers for the years ended December 31, 2005, 2004 and 2003 were not
significant. Foreign assets at December 31, 2005 and 2004 also were not significant. The Company does not
have revenue from transactions with a single customer amounting to 10 percent or more of its revenues.
The following table presents revenues of the Company’s operations based on location:
(for the year ended December 31, in millions) 2005 2004 2003
U.S. ............................................ $ 2 2,908 $ 2 1,640 $ 15,133
Non-U.S. ....................................... 1,457 904 6
Total revenues ................................ $ 2 4,365 $ 2 2,544 $ 1 5,139
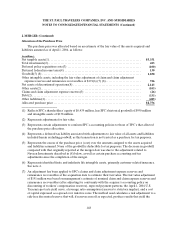
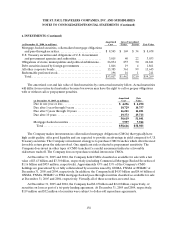
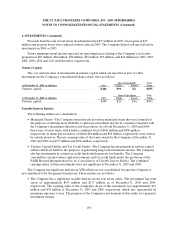
6. INVESTMENTS
Fixed Maturities
The Company’s investmentportfolio includes the fixed maturities, equity securities, and other
investments acquired in the merger at their fair values as of the merger date. The fair value at acquisition
became the new cost basis for these investments.
The amortized cost and fair value of investments in fixed maturities classified as available for sale
were as follows:
Amortized Gross Unrealized
(at December 31, 2005, in millions) Cost Gains Losses Fair Value
Mortgage-backed securities, collateralized mortgage
obligations and pass-through securities........... $ 7,997$ 66 $ 121 7,942
U.S. Treasury securities and obligations of U.S.
Governmentand government agencies and
authorities ................................... 3,4581835 3,441
Obligations of states, municipalities and political
subdivisions .................................. 31,372 587 137 31,822
Debt securities issuedby foreign governments...... 1,583116 1,588
All other corporate bonds ........................ 14,098 201 230 14,069
Redeemable preferredstock ...................... 108141 121
Total........................................ $ 58,616 $ 897 $ 530 $ 58,983