Travelers 2005 Annual Report Download - page 176
Download and view the complete annual report
Please find page 176 of the 2005 Travelers annual report below. You can navigate through the pages in the report by either clicking on the pages listed below, or by using the keyword search tool below to find specific information within the annual report.-
 1
1 -
2
-
3
-
4
-
5
-
6
-
7
-
8
-
9
-
10
-
11
-
12
-
13
-
14
-
15
-
16
-
17
-
18
-
19
-
20
-
21
-
22
-
23
-
24
-
25
-
26
-
27
-
28
-
29
-
30
-
31
-
32
-
33
-
34
-
35
-
36
-
37
-
38
-
39
-
40
-
41
-
42
-
43
-
44
-
45
-
46
-
47
-
48
-
49
-
50
-
51
-
52
-
53
-
54
-
55
-
56
-
57
-
58
-
59
-
60
-
61
-
62
-
63
-
64
-
65
-
66
-
67
-
68
-
69
-
70
-
71
-
72
-
73
-
74
-
75
-
76
-
77
-
78
-
79
-
80
-
81
-
82
-
83
-
84
-
85
-
86
-
87
-
88
-
89
-
90
-
91
-
92
-
93
-
94
-
95
-
96
-
97
-
98
-
99
-
100
-
101
-
102
-
103
-
104
-
105
-
106
-
107
-
108
-
109
-
110
-
111
-
112
-
113
-
114
-
115
-
116
-
117
-
118
-
119
-
120
-
121
-
122
-
123
-
124
-
125
-
126
-
127
-
128
-
129
-
130
-
131
-
132
-
133
-
134
-
135
-
136
-
137
-
138
-
139
-
140
-
141
-
142
-
143
-
144
-
145
-
146
-
147
-
148
-
149
-
150
-
151
-
152
-
153
-
154
-
155
-
156
-
157
-
158
-
159
-
160
-
161
-
162
-
163
-
164
-
165
-
 166
166 -
 167
167 -
 168
168 -
 169
169 -
 170
170 -
 171
171 -
 172
172 -
 173
173 -
 174
174 -
 175
175 -
 176
176 -
 177
177 -
 178
178 -
 179
179 -
 180
180 -
 181
181 -
 182
182 -
 183
183 -
 184
184 -
 185
185 -
 186
186 -
187
-
188
-
189
-
190
-
191
-
192
-
193
-
194
-
195
-
196
-
197
-
198
-
199
-
200
-
201
-
202
-
203
-
204
-
205
-
206
-
207
-
208
-
209
-
210
-
211
-
212
-
213
-
214
-
215
-
216
-
217
-
218
-
219
-
220
-
221
-
222
-
223
-
224
-
225
-
226
-
227
-
228
-
229
-
230
-
231
-
232
-
233
-
234
-
235
-
236
-
237
-
238
-
239
-
240
-
241
-
242
-
243
-
244
-
245
-
246
-
247
-
248
-
249
-
250
-
251
-
252
-
253
-
254
-
255
-
256
-
257
-
258
 |
 |

THE ST. PAUL TRAVELERS COMPANIES, INC.AND SUBSIDIARIES
NOTES TO CONSOLIDATED FINANCIAL STATEMENTS (Continued)
164
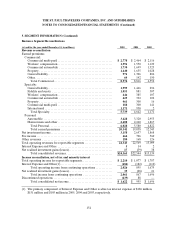
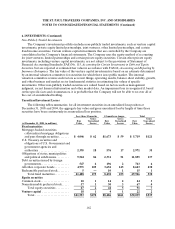
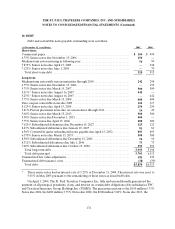
6. INVESTMENTS (Continued)
Concentrations and Credit Quality
At December 31, 2005 and 2004, the Company had concentrations of credit risk in tax-exempt
investments of the state of Texas of $3.27 billion and $2.30 billion, respectively, of the state of Illinois of
$1.84 billion and $1.50 billion, respectively, and of the state of New York of $1.67 billion and $1.44 billion,
respectively.
Included in fixed maturities are below investment grade assets totaling $1.75 billion and $1.78 billion
at December 31, 2005 and 2004, respectively. The Company defines its below investment grade assets as
those securities rated below investment grade by external rating agencies, or the equivalentby the
Company’s investment advisors whena public rating does not exist. Such assets include publicly traded
below investment grade bonds and certain other privately issued bonds that are classified as below
investment grade loans.
The Company monitors creditworthiness of counterparties to financial instruments by using controls
that include credit approvals, limits and other monitoring procedures.
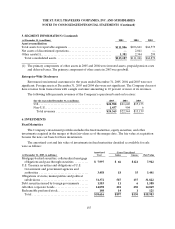
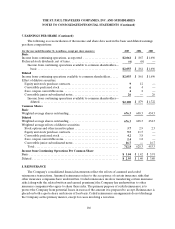
Net Investment Income
(for the year ended December 31, in millions) 2005 2004 2003
Gross investment income
Fixed maturities .................................... $2,530 $2,128 $ 1 ,527
Equity securities .................................... 41 47 143
Short-term securities ................................ 182 70 107
Mortgage loans and real estate ....................... 58 67 28
Other investments.................................. 427 456 119
Gross investment income .......................... 3,238 2,768 1,924
Investment expenses................................ 73 105 55
Net investment income ............................ $3,165 $2,663 $ 1 ,869
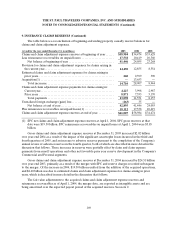
Net Realized and Unrealized Investment Gains (Losses)
Net realized investment gains (losses) for the periods were as follows:
(for the year ended December 31, in millions) 2005 2004 2003
Net realized investment gains (losses)
Fixed maturities ........................................ $ — $ 51 $69
Equity securities ........................................ 34 23 7
Venture capital and other................................ (17) (113 ) (38 )
Net realized investment gains (losses) ................... $17 $ (39) $38