Travelers 2005 Annual Report Download - page 111
Download and view the complete annual report
Please find page 111 of the 2005 Travelers annual report below. You can navigate through the pages in the report by either clicking on the pages listed below, or by using the keyword search tool below to find specific information within the annual report.-
 1
1 -
2
-
3
-
4
-
5
-
6
-
7
-
8
-
9
-
10
-
11
-
12
-
13
-
14
-
15
-
16
-
17
-
18
-
19
-
20
-
21
-
22
-
23
-
24
-
25
-
26
-
27
-
28
-
29
-
30
-
31
-
32
-
33
-
34
-
35
-
36
-
37
-
38
-
39
-
40
-
41
-
42
-
43
-
44
-
45
-
46
-
47
-
48
-
49
-
50
-
51
-
52
-
53
-
54
-
55
-
56
-
57
-
58
-
59
-
60
-
61
-
62
-
63
-
64
-
65
-
66
-
67
-
68
-
69
-
70
-
71
-
72
-
73
-
74
-
75
-
76
-
77
-
78
-
79
-
80
-
81
-
82
-
83
-
84
-
85
-
86
-
87
-
88
-
89
-
90
-
91
-
92
-
93
-
94
-
95
-
96
-
97
-
98
-
99
-
100
-
 101
101 -
 102
102 -
 103
103 -
 104
104 -
 105
105 -
 106
106 -
 107
107 -
 108
108 -
 109
109 -
 110
110 -
 111
111 -
 112
112 -
 113
113 -
 114
114 -
 115
115 -
 116
116 -
 117
117 -
 118
118 -
 119
119 -
 120
120 -
 121
121 -
122
-
123
-
124
-
125
-
126
-
127
-
128
-
129
-
130
-
131
-
132
-
133
-
134
-
135
-
136
-
137
-
138
-
139
-
140
-
141
-
142
-
143
-
144
-
145
-
146
-
147
-
148
-
149
-
150
-
151
-
152
-
153
-
154
-
155
-
156
-
157
-
158
-
159
-
160
-
161
-
162
-
163
-
164
-
165
-
166
-
167
-
168
-
169
-
170
-
171
-
172
-
173
-
174
-
175
-
176
-
177
-
178
-
179
-
180
-
181
-
182
-
183
-
184
-
185
-
186
-
187
-
188
-
189
-
190
-
191
-
192
-
193
-
194
-
195
-
196
-
197
-
198
-
199
-
200
-
201
-
202
-
203
-
204
-
205
-
206
-
207
-
208
-
209
-
210
-
211
-
212
-
213
-
214
-
215
-
216
-
217
-
218
-
219
-
220
-
221
-
222
-
223
-
224
-
225
-
226
-
227
-
228
-
229
-
230
-
231
-
232
-
233
-
234
-
235
-
236
-
237
-
238
-
239
-
240
-
241
-
242
-
243
-
244
-
245
-
246
-
247
-
248
-
249
-
250
-
251
-
252
-
253
-
254
-
255
-
256
-
257
-
258
 |
 |
99
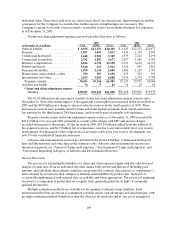
Net cash flows used in investing activitiesof continuing operations to taled $3.04 billion, $4.65 bill ion
and $2.48 billion in 2005, 2004 and 2003, respectively. Fixed maturity securities accounted for the majority
of investment purchases in all three years. In 2003, cash used in investing activities was partly offset by sales
of securities to fundnet payment activity related to debt and junior subordinated debt securities held by
subsidiary trusts of $772 million.
The Company’s cash flows in 2005 included $2.40 billion of pretax proceeds (after underwritingfees
and transaction costs) from the divestiture of its equity interest in Nuveen Investments. Of this amount,
$405 million was received directly by the Company’s insurance subsidiaries, and the remainder was
received directly by the holding company. Of the proceeds received directly by the holding company,
$1.225 billion was contributed to the capital of the Company’s insurance subsidiaries, with the remainder
available for general corporate purposes. Holding company liquidity levels were increased in 2005 through
dividends received from the Company’s operating subsidiaries, the retained proceeds from the Nuveen
Investments divestiture, the third quarter 2005 proceeds of $442 million from the settlement of the forward
purchase contracts for the Company’s common stock related to equity units issued in 2002 (described in
more detail below), and the fourth quarter issuance of $400 million of 5.50% senior notes. Net cash flows
of discontinued operations were not significant in 2005 or 2004.
The majority of funds available for investment are deployed in a widely diversified portfolio of high
quality, liquid intermediate-term taxable U.S. government, corporate and mortgage backed bonds and tax-
exempt U.S. municipal bonds. The Company closely monitors the duration of its fixed maturity
investments, and investment purchases and sales are executed with the objective of having adequate funds
available to satisfy the Company’s insurance and debt obligations. The Company’s management of the
duration of the fixed income investment portfolio generally produces a duration that exceeds the duration
of the Company’s net insurance liabilities.As the Company’s investment strategy focuses on asset and
liability durations, and not specific cash flows, asset sales may be required to satisfy obligations and/or
rebalance asset portfolios. The average duration of fixed maturities and short-term securities was 3.9 years
at December 31, 2005, compared with 4.1 years at December 31, 2004.
The Company also invests much smaller amounts in equity securities, venture capital and real estate.
These investment classes have the potential for higher returns but also involve varying degrees of risk,
including less stable rates of return and less liquidity.
The primary goals of the Company’s asset liability management process are to satisfy the insurance
liabilities, manage the interest rate risk embedded in those insurance liabilities, and maintain sufficient
liquidity to cover fluctuations in projected liability cash flows. Generally, the expected principal and
interest payments produced by the Company’s fixed income portfolio adequately fund the estimated runoff
of the Company’s insurance reserves. Although this isnot an exact cash flow match in each period, the
substantial degree by which the market value of the fixed income portfolio exceeds the present value of the
net insurance liabilities, plus the positive cash flow from newly sold policies and the large amountof high
quality liquid bonds provides assurance of the Company’s ability to fund the payment of claims without
having to sell illiquid assets or access credit facilities.
At December 31, 2005, total cash, short-term invested assets and other readily marketable securities
aggregating $1.57 billion were held at the holding company level. These assets were primarily funded by
dividends from subsidiaries, proceeds from the divestiture of Nuveen Investments, and proceeds from the
issuance of common stock and debt as described below. As also noted above, the holding company
contributed $1.225 billion of the Nuveen Investment proceeds to the capital of its insurance subsidiaries in
the third quarter of 2005. The assets held at the holding company, combined with other sources of funds
available, primarily additional dividends from operating subsidiaries, are considered sufficient to meet the
liquidity requirements of the Company. These liquidity requirements primarily include shareholder
dividends and debt service.