Travelers 2005 Annual Report Download - page 205
Download and view the complete annual report
Please find page 205 of the 2005 Travelers annual report below. You can navigate through the pages in the report by either clicking on the pages listed below, or by using the keyword search tool below to find specific information within the annual report.-
 1
1 -
2
-
3
-
4
-
5
-
6
-
7
-
8
-
9
-
10
-
11
-
12
-
13
-
14
-
15
-
16
-
17
-
18
-
19
-
20
-
21
-
22
-
23
-
24
-
25
-
26
-
27
-
28
-
29
-
30
-
31
-
32
-
33
-
34
-
35
-
36
-
37
-
38
-
39
-
40
-
41
-
42
-
43
-
44
-
45
-
46
-
47
-
48
-
49
-
50
-
51
-
52
-
53
-
54
-
55
-
56
-
57
-
58
-
59
-
60
-
61
-
62
-
63
-
64
-
65
-
66
-
67
-
68
-
69
-
70
-
71
-
72
-
73
-
74
-
75
-
76
-
77
-
78
-
79
-
80
-
81
-
82
-
83
-
84
-
85
-
86
-
87
-
88
-
89
-
90
-
91
-
92
-
93
-
94
-
95
-
96
-
97
-
98
-
99
-
100
-
101
-
102
-
103
-
104
-
105
-
106
-
107
-
108
-
109
-
110
-
111
-
112
-
113
-
114
-
115
-
116
-
117
-
118
-
119
-
120
-
121
-
122
-
123
-
124
-
125
-
126
-
127
-
128
-
129
-
130
-
131
-
132
-
133
-
134
-
135
-
136
-
137
-
138
-
139
-
140
-
141
-
142
-
143
-
144
-
145
-
146
-
147
-
148
-
149
-
150
-
151
-
152
-
153
-
154
-
155
-
156
-
157
-
158
-
159
-
160
-
161
-
162
-
163
-
164
-
165
-
166
-
167
-
168
-
169
-
170
-
171
-
172
-
173
-
174
-
175
-
176
-
177
-
178
-
179
-
180
-
181
-
182
-
183
-
184
-
185
-
186
-
187
-
188
-
189
-
190
-
191
-
192
-
193
-
194
-
 195
195 -
 196
196 -
 197
197 -
 198
198 -
 199
199 -
 200
200 -
 201
201 -
 202
202 -
 203
203 -
 204
204 -
 205
205 -
 206
206 -
 207
207 -
 208
208 -
 209
209 -
 210
210 -
 211
211 -
 212
212 -
 213
213 -
 214
214 -
 215
215 -
216
-
217
-
218
-
219
-
220
-
221
-
222
-
223
-
224
-
225
-
226
-
227
-
228
-
229
-
230
-
231
-
232
-
233
-
234
-
235
-
236
-
237
-
238
-
239
-
240
-
241
-
242
-
243
-
244
-
245
-
246
-
247
-
248
-
249
-
250
-
251
-
252
-
253
-
254
-
255
-
256
-
257
-
258
 |
 |

THE ST. PAUL TRAVELERS COMPANIES, INC.AND SUBSIDIARIES
NOTES TO CONSOLIDATED FINANCIAL STATEMENTS (Continued)
193
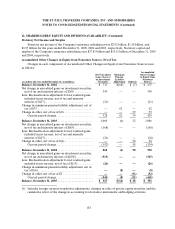
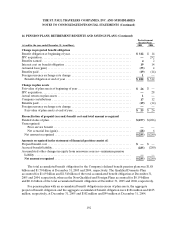
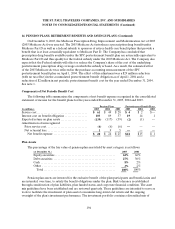
14. PENSION PLANS,RETIREMENT BENEFITS AND SAVINGS PLANS
respectively. The fair value of plan assets for the above plans was $88million and $23 million at
December 31, 2005 and 2004, respectively.
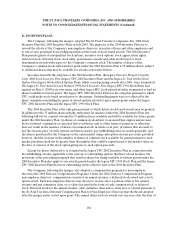
The Company does not have a best estimate of contributions expected to be paid to the qualified
pension plan during the next fiscal year at this time.
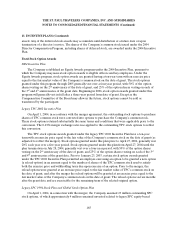
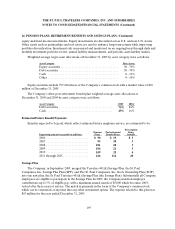
Assumptions and Health Care Cost Trend Rate Sensitivity
(at and for the year ended December 31,) 2005 2004
Assumptions used to determine benefit obligations
Discount rate......................................................... 5.75 %6.00%
Future compensation increase rate ...................................... 4.00 %4.00%
Assumptions used to determine net periodic benefit cost
Discount rate......................................................... 6.00 %6.00% to6.25%
Expected long-term rate of return on assets............................... 8.00 %8.00%
Assumed health care cost trend rates
Following year:
Medical (before age 65).............................................. 9.00 %10.00%
Medical (age65 andolder)........................................... 11.00 % 10.00%
Rate to which the cost trend rate is assumed to decline (ultimate trend rate) .. 5.00 %5.00%
Year that the rate reaches the ultimate trend rate:
Medical (before age 65).............................................. 2010 2010
Medical (age65 andolder)........................................... 2012 2010
The discountrate assumption used to determine the benefit obligation is based on the Moody’s Aa
Corporate Bond index adjusted by 25 basis points to reflect the long duration nature of the pension
obligation and adjusted to the nearest quarter rate. The discount rate is then back-tested by comparison to
a yield curve that reflects the hypothetical portfolio of high quality bonds (rated Aa or higher by a
recognized rating agency) for which the timing and amount of cash outflows approximates the estimated
payouts of the Plan.
In choosing the expected long-term rate of return, the Company’s Pension Plan Investment
Committee considered the historical returns of equity and fixed income markets in conjunction with
today’s economic and financial market conditions.
As an indicator of sensitivity, increasing the assumed health care cost trend rate by 1% would have
increased the accumulated postretirement benefit obligation by $47 million at December 31, 2005, and the
aggregate of the service and interest cost components of net postretirement benefit expense by $4 million
for the year ended December 31, 2005. Decreasing the assumed health care cost trend rate by 1% would
have decreased the accumulated postretirement benefit obligation at December 31, 2005 by $38 million
and the aggregate of the service and interest cost components of net postretirement benefit expense by $3
million for the year ended December 31, 2005.
(Continued)