Travelers 2005 Annual Report Download - page 88
Download and view the complete annual report
Please find page 88 of the 2005 Travelers annual report below. You can navigate through the pages in the report by either clicking on the pages listed below, or by using the keyword search tool below to find specific information within the annual report.-
 1
1 -
2
-
3
-
4
-
5
-
6
-
7
-
8
-
9
-
10
-
11
-
12
-
13
-
14
-
15
-
16
-
17
-
18
-
19
-
20
-
21
-
22
-
23
-
24
-
25
-
26
-
27
-
28
-
29
-
30
-
31
-
32
-
33
-
34
-
35
-
36
-
37
-
38
-
39
-
40
-
41
-
42
-
43
-
44
-
45
-
46
-
47
-
48
-
49
-
50
-
51
-
52
-
53
-
54
-
55
-
56
-
57
-
58
-
59
-
60
-
61
-
62
-
63
-
64
-
65
-
66
-
67
-
68
-
69
-
70
-
71
-
72
-
73
-
74
-
75
-
76
-
77
-
 78
78 -
 79
79 -
 80
80 -
 81
81 -
 82
82 -
 83
83 -
 84
84 -
 85
85 -
 86
86 -
 87
87 -
 88
88 -
 89
89 -
 90
90 -
 91
91 -
 92
92 -
 93
93 -
 94
94 -
 95
95 -
 96
96 -
 97
97 -
 98
98 -
99
-
100
-
101
-
102
-
103
-
104
-
105
-
106
-
107
-
108
-
109
-
110
-
111
-
112
-
113
-
114
-
115
-
116
-
117
-
118
-
119
-
120
-
121
-
122
-
123
-
124
-
125
-
126
-
127
-
128
-
129
-
130
-
131
-
132
-
133
-
134
-
135
-
136
-
137
-
138
-
139
-
140
-
141
-
142
-
143
-
144
-
145
-
146
-
147
-
148
-
149
-
150
-
151
-
152
-
153
-
154
-
155
-
156
-
157
-
158
-
159
-
160
-
161
-
162
-
163
-
164
-
165
-
166
-
167
-
168
-
169
-
170
-
171
-
172
-
173
-
174
-
175
-
176
-
177
-
178
-
179
-
180
-
181
-
182
-
183
-
184
-
185
-
186
-
187
-
188
-
189
-
190
-
191
-
192
-
193
-
194
-
195
-
196
-
197
-
198
-
199
-
200
-
201
-
202
-
203
-
204
-
205
-
206
-
207
-
208
-
209
-
210
-
211
-
212
-
213
-
214
-
215
-
216
-
217
-
218
-
219
-
220
-
221
-
222
-
223
-
224
-
225
-
226
-
227
-
228
-
229
-
230
-
231
-
232
-
233
-
234
-
235
-
236
-
237
-
238
-
239
-
240
-
241
-
242
-
243
-
244
-
245
-
246
-
247
-
248
-
249
-
250
-
251
-
252
-
253
-
254
-
255
-
256
-
257
-
258
 |
 |

76
impact of merger-related restructuring charges and an increase in the allowance for uncollectible amounts
due from policyholders. The 2.9 point increase in the underwriting expense ratio in 2004 compared to 2003
primarily reflected the impact of the higher underwriting expense ratio of business in runoff (some of which
was acquired in the merger), the merger-related restructuring charges and the increase in the allowance for
uncollectible amounts due from policyholders.
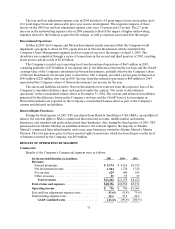
Written Premiums
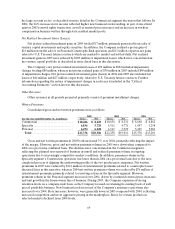
The Commercial segment’s gross and net written premiums by market were as follows:
2005 2004 2003
(for the year ended December 31, in millions) Gross Net Gross Net Gross Net
Commercial Accounts..................... $4,852 $4,386 $4,648 $4,210 $3,593 $3,251
Select Accounts .......................... 2,799 2,722 2,631 2,555 2,105 2,047
National Accounts ........................ 2,627 1,230 2,410 1,040 1,462 831
Total Commercial Core ................. 10,278 8,338 9,689 7,805 7,160 6,129
Commercial Other. ....................... 148 91 947 506 1,508 733
Total Commercial ...................... $ 1 0,426 $ 8 ,429 $10,636 $8,311 $8,668 $6,862
In Commercial Core operations, gross and net written premiums increased 6% and 7% over 2004 totals,
primarily reflecting the impact of the merger. However, 2005 written premium volume in Commercial Core
operations declined when compared with 2004 on a pro forma combined basis, due to increasing competition
in the marketplace and pricing levels that were flat with 2004. Business retention levels throughout the Core
Commercial operations, however, increased over 2004, and new business levels improved over 2004. Net
written premiums in 2005 for Commercial Core operations were reduced by the $52 million of reinstatement
premiums related to catastrophe losses described in the “Consolidated Overview” section herein. In
Commercial Other operations, gross and net written premiums declined 84% and 82%, respectively, from the
comparable 2004 totals, reflecting the intentional non-renewal of business in therunoff operations comprising
this category.
Commercial’s gross and net written premiums in 2004 increased 23% and 21%, respectively, over the
2003 totals, primarily reflecting the impact of the merger. New business volume in 2004 declined when
compared with the combined new business volume of SPC and TPC in 2003, reflectingthe increasingly
competitive marketplace and the impact of higher premium flow in 2003 associated withseveral renewal
rights transactions.
In the Commercial Accounts market, net written premiums of $4.39 billion grew $176 million, or 4%,
over 2004 volume of $4.21 billion, primarily reflecting the impact of the merger. However, 2005 written
premium declined from 2004 on a pro forma combined basis. Business retention levels in this market in 2005
increased over 2004 and were at historically high levels for the year. New business volume also grew over
2004. Renewal price changes in 2005 in Commercial Accounts declined from 2004 and were modestly
negative for the year, reflecting the increased competitive market conditions. Commercial Accounts’ net
premium volume in 2004 grew $959 million, or 29%, over 2003 volume of $3.25 billion, primarily due to the
merger. Retention rates in 2004 were strong and renewal price change increases were essentially flat by the
end of the year. New business levels were lower during the second half of 2004 as the benefit from the
Atlantic Mutual and Royal & SunAlliance renewal rights transactions entered into in the third quarter of
2003 diminished in the secondhalf of the year.
In the Select Accounts market, net written premiums in 2005 grew 7% over 2004, primarily reflecting the
impact of the merger. However, 2005 written premium declined from 2004 on a pro forma combined basis.
Business retention levels in 2005 increased over 2004 as the year progressed and were also at historically high
levels for the year in total. Renewal price changes in Select Accounts in 2005 were in the low single digit
range for the year, which was lower thanrenewal price increases in 2004. New business levels in Select