Travelers 2005 Annual Report Download - page 117
Download and view the complete annual report
Please find page 117 of the 2005 Travelers annual report below. You can navigate through the pages in the report by either clicking on the pages listed below, or by using the keyword search tool below to find specific information within the annual report.-
 1
1 -
2
-
3
-
4
-
5
-
6
-
7
-
8
-
9
-
10
-
11
-
12
-
13
-
14
-
15
-
16
-
17
-
18
-
19
-
20
-
21
-
22
-
23
-
24
-
25
-
26
-
27
-
28
-
29
-
30
-
31
-
32
-
33
-
34
-
35
-
36
-
37
-
38
-
39
-
40
-
41
-
42
-
43
-
44
-
45
-
46
-
47
-
48
-
49
-
50
-
51
-
52
-
53
-
54
-
55
-
56
-
57
-
58
-
59
-
60
-
61
-
62
-
63
-
64
-
65
-
66
-
67
-
68
-
69
-
70
-
71
-
72
-
73
-
74
-
75
-
76
-
77
-
78
-
79
-
80
-
81
-
82
-
83
-
84
-
85
-
86
-
87
-
88
-
89
-
90
-
91
-
92
-
93
-
94
-
95
-
96
-
97
-
98
-
99
-
100
-
101
-
102
-
103
-
104
-
105
-
106
-
 107
107 -
 108
108 -
 109
109 -
 110
110 -
 111
111 -
 112
112 -
 113
113 -
 114
114 -
 115
115 -
 116
116 -
 117
117 -
 118
118 -
 119
119 -
 120
120 -
 121
121 -
 122
122 -
 123
123 -
 124
124 -
 125
125 -
 126
126 -
 127
127 -
128
-
129
-
130
-
131
-
132
-
133
-
134
-
135
-
136
-
137
-
138
-
139
-
140
-
141
-
142
-
143
-
144
-
145
-
146
-
147
-
148
-
149
-
150
-
151
-
152
-
153
-
154
-
155
-
156
-
157
-
158
-
159
-
160
-
161
-
162
-
163
-
164
-
165
-
166
-
167
-
168
-
169
-
170
-
171
-
172
-
173
-
174
-
175
-
176
-
177
-
178
-
179
-
180
-
181
-
182
-
183
-
184
-
185
-
186
-
187
-
188
-
189
-
190
-
191
-
192
-
193
-
194
-
195
-
196
-
197
-
198
-
199
-
200
-
201
-
202
-
203
-
204
-
205
-
206
-
207
-
208
-
209
-
210
-
211
-
212
-
213
-
214
-
215
-
216
-
217
-
218
-
219
-
220
-
221
-
222
-
223
-
224
-
225
-
226
-
227
-
228
-
229
-
230
-
231
-
232
-
233
-
234
-
235
-
236
-
237
-
238
-
239
-
240
-
241
-
242
-
243
-
244
-
245
-
246
-
247
-
248
-
249
-
250
-
251
-
252
-
253
-
254
-
255
-
256
-
257
-
258
 |
 |

105
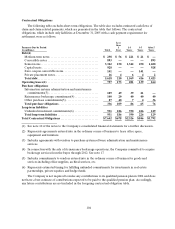
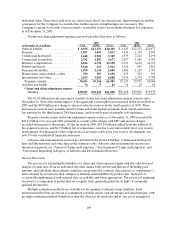
Estimated Claims and Claim Related Payments
The table below presents the amount and estimated future timing of claims and claim related
payments. The amounts do not represent the exact liability, but instead represent estimates, generally
utilizing actuarial projections techniques, at a given accounting date. These estimates include expectations
of what the ultimate settlement and administration of claims will cost based on the Company’s assessment
of facts and circumstances then known, review of historical settlement patterns, estimates of trends in
claims severity, frequency, legal theories of liability and other factors. Variables in the reserve estimation
process can be affected by both internal and external events, such as changes in claims handling
procedures, economic inflation, legal trends and legislative changes. Many of these items are not directly
quantifiable, particularly on a prospective basis. Additionally, there may be significant reporting lags
between the occurrence of the policyholder event and the time it is actually reported to the insurer. The
future cash flows related to the items contained in the table below, required estimation of both amount
(including severity considerations) and timing. Amount and timing are frequently estimated separately. An
estimation of both amountand timing of future cash flows related to claims and claim related payments is
generally reliable only in the aggregate with some unavoidable estimation uncertainty.
The following table includes estimated future claims and claims related payments, net of the estimated
reinsurance recoveries, where applicable, at December 31, 2005.
Estimated Payments by Period
(in millions) Total
Less
than 1
Year
1-3
Years
3-5
Years
After 5
Years
Estimated future paymentsresulting from:
(1) Claims and claim adjustment expenses ........ $ 4 3,782 $ 1 2,203 $ 1 3,693 $6,375 $11,511
(2) Claims from large deductible polices......... — — — — —
(3) Loss-based assessments ..................... 224 30 51 24 119
(4) Reinsurance contracts accounted for as
deposits.................................. 421 135 241 45 —
(5)Payout from ceded funds withheld ........... 499 22 168 90 219
Total .................................... $ 4 4,926 $ 1 2,390 $ 1 4,153 $6,534 $11,849
(1) The amounts in “Claims and claim adjustment expenses” in the table above represent the estimated
timing of future payments for both reported and unreported claims incurred and related claim
adjustment expenses, net of reinsurance recoverables. Therefore, estimated future payments include
cash inflows related to reinsurance arrangements that qualify for reinsurance accounting. A
reinsurance agreement must indemnify the insurer from insurance risk, i.e., the agreement must
transfer amount and timing risk, in order to qualify for reinsurance accounting. Since the timing and
amount of cash inflows from such reinsurance agreements are highly correlated to the underlying
payment of claims and claim adjustment expenses by the insurer, the analysis above presents the
estimated cash outflows for reported and unreported claims incurred and related claim adjustment
expense, net of reinsurance. Reinsurance agreements that do not transfer both amount and timingrisk
are accounted for as deposits and included in “Reinsurance contracts accounted for as deposits” in the
table above.
For business underwritten by non-U.S. operations, future cash flows related to reported and
unreported claims incurred and related claim adjustment expenses were translated at the spot rate on
December 31, 2005.