Travelers 2005 Annual Report Download - page 41
Download and view the complete annual report
Please find page 41 of the 2005 Travelers annual report below. You can navigate through the pages in the report by either clicking on the pages listed below, or by using the keyword search tool below to find specific information within the annual report.-
 1
1 -
2
-
3
-
4
-
5
-
6
-
7
-
8
-
9
-
10
-
11
-
12
-
13
-
14
-
15
-
16
-
17
-
18
-
19
-
20
-
21
-
22
-
23
-
24
-
25
-
26
-
27
-
28
-
29
-
30
-
 31
31 -
 32
32 -
 33
33 -
 34
34 -
 35
35 -
 36
36 -
 37
37 -
 38
38 -
 39
39 -
 40
40 -
 41
41 -
 42
42 -
 43
43 -
 44
44 -
 45
45 -
 46
46 -
 47
47 -
 48
48 -
 49
49 -
 50
50 -
 51
51 -
52
-
53
-
54
-
55
-
56
-
57
-
58
-
59
-
60
-
61
-
62
-
63
-
64
-
65
-
66
-
67
-
68
-
69
-
70
-
71
-
72
-
73
-
74
-
75
-
76
-
77
-
78
-
79
-
80
-
81
-
82
-
83
-
84
-
85
-
86
-
87
-
88
-
89
-
90
-
91
-
92
-
93
-
94
-
95
-
96
-
97
-
98
-
99
-
100
-
101
-
102
-
103
-
104
-
105
-
106
-
107
-
108
-
109
-
110
-
111
-
112
-
113
-
114
-
115
-
116
-
117
-
118
-
119
-
120
-
121
-
122
-
123
-
124
-
125
-
126
-
127
-
128
-
129
-
130
-
131
-
132
-
133
-
134
-
135
-
136
-
137
-
138
-
139
-
140
-
141
-
142
-
143
-
144
-
145
-
146
-
147
-
148
-
149
-
150
-
151
-
152
-
153
-
154
-
155
-
156
-
157
-
158
-
159
-
160
-
161
-
162
-
163
-
164
-
165
-
166
-
167
-
168
-
169
-
170
-
171
-
172
-
173
-
174
-
175
-
176
-
177
-
178
-
179
-
180
-
181
-
182
-
183
-
184
-
185
-
186
-
187
-
188
-
189
-
190
-
191
-
192
-
193
-
194
-
195
-
196
-
197
-
198
-
199
-
200
-
201
-
202
-
203
-
204
-
205
-
206
-
207
-
208
-
209
-
210
-
211
-
212
-
213
-
214
-
215
-
216
-
217
-
218
-
219
-
220
-
221
-
222
-
223
-
224
-
225
-
226
-
227
-
228
-
229
-
230
-
231
-
232
-
233
-
234
-
235
-
236
-
237
-
238
-
239
-
240
-
241
-
242
-
243
-
244
-
245
-
246
-
247
-
248
-
249
-
250
-
251
-
252
-
253
-
254
-
255
-
256
-
257
-
258
 |
 |

29
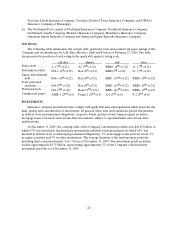
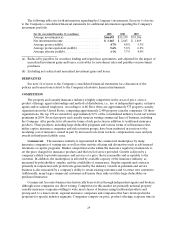
The following table sets forth information regarding the Company’s investments. See note 6 of notes
to the Company’s consolidated financial statements for additional information regarding the Company’s
investment portfolio.
(for the year ended December 31, in millions) 2005 2004 2003
Average investments(a).......................... $ 6 6,695 $ 5 5,139 $ 3 5,306
Net investment income.......................... $3,165 $2,663 $1,869
Average pretax yield(b).......................... 4.7%4.8 % 5.3 %
Average pretax equivalent yield(b)................ 5.6%5.6 % 6.2 %
Average aftertax yield(b). ........................ 3.7%3.7 % 4.0 %
(a) Reduced by payables for securities lending and repurchase agreements, and adjusted for the impact of
unrealized investment gains and losses, receivables for investment sales and payables on investment
purchases.
(b) Excluding net realized and unrealized investment gains and losses.
DERIVATIVES
See note 16 of notes to the Company’s consolidated financial statements for a discussion of the
policies and transactions related to the Company’s derivative financial instruments.
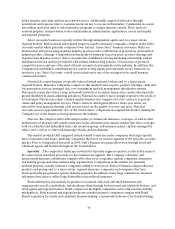
COMPETITION
The property and casualty insurance industry is highly competitive in the areas of price, service,
product offerings, agent relationships and method of distribution, i.e., use of independent agents, exclusive
agents and/or salaried employees. According to A.M. Best, there are approximately 975 property casualty
organizations in the United States, comprising approximately 2,400 property casualty companies. Of those
organizations, the top 150 accounted for approximately 92% of the consolidated industry’s total net written
premiums in2004. Several property and casualty insurers writing commercial lines of business, including
the Company, offer products for alternative forms of risk protection in addition to traditional insurance
products. These products, including large deductible programs and various forms of self-insurance that
utilize captive insurance companies and risk retention groups, have been instituted in reaction to the
escalating cost of insurance caused in part by increased costs from workers’ compensation cases and jury
awards in third-party liability cases.
Commercial. The insurance industry is represented in the commercial marketplace by many
insurance companies of varying size as well as other entities offering risk alternatives such as self-insured
retentions or captive programs. Market competition works within the insurance regulatory framework to
set the price charged for insurance products and the level of service provided. Growth is driven by a
company’s ability to provide insurance and services at a price that is reasonable and acceptable to the
customer. In addition, the marketplace is affected by available capacity of the insurance industry, as
measured by policyholders’ surplus, and the availability of reinsurance. Surplus expands and contracts
primarily in conjunction with profit levels generated by the industry. Growth in premium and service
business is also measured by a company’s ability to retain existing customers and to attract new customers.
Additionally, many large commercial customers self-insure their risks or utilize large deductibles on
purchased insurance.
Commercial Accounts business has historically been written through independent agents and brokers,
although some companies use direct writing. Competitors in this market are primarily national property
casualty insurance companies willing to write most classes of business using traditional products and
pricing and, to a lesser extent, regional insurance companies and companies that have developed niche
programs for specific industry segments. Companies compete on price, product offerings, response time in