Travelers 2005 Annual Report Download - page 35
Download and view the complete annual report
Please find page 35 of the 2005 Travelers annual report below. You can navigate through the pages in the report by either clicking on the pages listed below, or by using the keyword search tool below to find specific information within the annual report.-
 1
1 -
2
-
3
-
4
-
5
-
6
-
7
-
8
-
9
-
10
-
11
-
12
-
13
-
14
-
15
-
16
-
17
-
18
-
19
-
20
-
21
-
22
-
23
-
24
-
 25
25 -
 26
26 -
 27
27 -
 28
28 -
 29
29 -
 30
30 -
 31
31 -
 32
32 -
 33
33 -
 34
34 -
 35
35 -
 36
36 -
 37
37 -
 38
38 -
 39
39 -
 40
40 -
 41
41 -
 42
42 -
 43
43 -
 44
44 -
 45
45 -
46
-
47
-
48
-
49
-
50
-
51
-
52
-
53
-
54
-
55
-
56
-
57
-
58
-
59
-
60
-
61
-
62
-
63
-
64
-
65
-
66
-
67
-
68
-
69
-
70
-
71
-
72
-
73
-
74
-
75
-
76
-
77
-
78
-
79
-
80
-
81
-
82
-
83
-
84
-
85
-
86
-
87
-
88
-
89
-
90
-
91
-
92
-
93
-
94
-
95
-
96
-
97
-
98
-
99
-
100
-
101
-
102
-
103
-
104
-
105
-
106
-
107
-
108
-
109
-
110
-
111
-
112
-
113
-
114
-
115
-
116
-
117
-
118
-
119
-
120
-
121
-
122
-
123
-
124
-
125
-
126
-
127
-
128
-
129
-
130
-
131
-
132
-
133
-
134
-
135
-
136
-
137
-
138
-
139
-
140
-
141
-
142
-
143
-
144
-
145
-
146
-
147
-
148
-
149
-
150
-
151
-
152
-
153
-
154
-
155
-
156
-
157
-
158
-
159
-
160
-
161
-
162
-
163
-
164
-
165
-
166
-
167
-
168
-
169
-
170
-
171
-
172
-
173
-
174
-
175
-
176
-
177
-
178
-
179
-
180
-
181
-
182
-
183
-
184
-
185
-
186
-
187
-
188
-
189
-
190
-
191
-
192
-
193
-
194
-
195
-
196
-
197
-
198
-
199
-
200
-
201
-
202
-
203
-
204
-
205
-
206
-
207
-
208
-
209
-
210
-
211
-
212
-
213
-
214
-
215
-
216
-
217
-
218
-
219
-
220
-
221
-
222
-
223
-
224
-
225
-
226
-
227
-
228
-
229
-
230
-
231
-
232
-
233
-
234
-
235
-
236
-
237
-
238
-
239
-
240
-
241
-
242
-
243
-
244
-
245
-
246
-
247
-
248
-
249
-
250
-
251
-
252
-
253
-
254
-
255
-
256
-
257
-
258
 |
 |

23
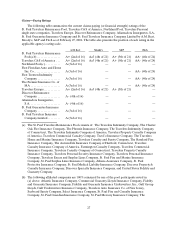
(at December 31, in millions) 1995(a)1996(a)1997(a)1998(a)1999(a)2000(a)2001(a)(b)2002(a)(b) 2003(a)(b) 2004(a)(b)(c) 2005(a)(b)(c)
Reserves for claims and
claim adjustment expense originally
estimated..................... $ 10,090$ 2 1,8 16 $ 21,406$ 2 0,763$ 1 9,983$ 1 9,435$ 2 0,197$ 2 3,268$ 2 4,055$ 4 1,446$ 42,895
Cumulative amounts paid as of
Oneyear later ................. 1,5213,704 4,0254,159 4,0824,374 5,0185,170 4,6518,871
Twoyears later ................ 2,8096,600 6,8826,879 6,9577,517 8,7458,319 8,686
Three yearslater ............... 3,9038,841 8,8509,0069,324 10,21811,14911,312
Four years later................ 4,76110,35510,48010,80911,49312,00013,402
Five years later................ 5,32211,64911,91512,56512,91113,603
Six years later ................. 5,84212,89313,3 76 13,64714,172
Seven yearslater ............... 6,14614,15414,30614,697
Eightyears later................ 6,66814,98715,225
Nineyears later ................ 7,01315,844
Tenyearslater. ................ 7,411
Reserves reestimated as of
Oneyear later ................. 9,848 21,34521,08320,52119,73619,3 94 23,22823,65824,22241,706
Twoyears later ................ 9,78521,16020,6 97 20,17219,60022,23324,08324,59225,272
Three yearslater ............... 9,78920,81620,41719,97522,30222,77825,06225,553
Four years later................ 9,73520,66420,1 68 22,48922,61223,87125,953
Five years later................ 9,71120,42722,5 70 22,59323,59124,872
Six years later ................. 9,66122,85122,62523,49224,559
Seven yearslater ............... 10,56222,86123,53024,446
Eightyears later................ 10,55323,75924,425
Nineyears later ................ 10,94524,601
Tenyearslater. ................ 11,363
Cumulative deficiency(a)(b)(c)...... 1,2732,785 3,0193,683 4,5765,437 5,7562,285 1,217260
Grossliability–endofyear ......... $ 15,213 $ 30,969$ 3 0,138$ 2 9,411$ 2 8,854$ 2 8,312$ 3 0,617$ 3 3,628$ 3 4,4 74 $ 58,984 $ 61,007
Reinsurance recoverables .......... 5,1239,153 8,7328,648 8,8718,877 10,42010,36010,41917,53818,112
Netliability–endofyear ........... $ 10,0 90 $ 21,816$ 2 1,406$ 2 0,763$ 1 9,983$ 1 9,435$ 2 0,197$ 2 3,268$ 2 4,055$ 41,446 $ 42,895
Gross reestimated liability-latest..... $ 16,473$ 3 3,765$ 3 3,242$ 3 3,5 67 $ 34,390$ 3 5,406$ 3 7,991$ 3 6,961$ 36,074$ 5 9,191
Reestimated reinsurance recoverables-
latest ........................ 5,1109,164 8,8179,121 9,83110,5 34 12,03811,40810,80217,485
Net reestimated liability-latest ...... $ 11,363$ 2 4,601$ 2 4,425$ 2 4,4 46 $ 24,559$ 2 4,872$ 2 5,953$ 2 5,553$ 25,272$ 4 1,706
Gross cumulative deficiency ........ $ 1,260$ 2,796 $ 3,104$ 4,156 $ 5,536$ 7,094 $ 7,374$ 3,333 $ 1,600$207
Included in the cumulative deficiency by year is the impact of unfavorable prior year reserve
development, net of reinsurance, related to asbestos claims and litigation, primarily due to $2,945million
of unfavorable development in 2002, accretion of discount of $25 million in 2003, $416 million of
unfavorable development in 2004 and unfavorable development of $831 million in2005, asfollows, in
millions:
(at December 31, in millions) 1995 1996 1997 1998 1999 2000 2001 2002 2003 2004
Reserves for claims and
claim adjustment expense originally
estimated .................... $ 2,029$ 4,370 $ 4,301$ 4,235 $ 4,178 $ 4,128$ 3,939 $994 $970 $831
(a) For 1995, excludes Aetna P&C reserves, which were acquired on April 2, 1996. Accordingly, the reserve development (net
reserves for claims and claim adjustment expenses reestimated as of subsequent years less net reserves recorded at the end of
the year, asoriginally estimated) for 1995 relates only tolosses recorded by TPC and does not include reserve development
recorded by Aetna P&C. For 1996 and subsequent years, includes Aetna P&C reserves and subsequent development recorded
by Aetna P&C. At December 31,1996Aetna P&C gross reserves were $15,555 million and net reserves were $11,608 million.
(b) Includes reserves of The Northland Company and its subsidiaries and Commercial GuarantyLloyds Insurance Company which
were acquired from Citigroup on October 1, 2001. Also includes reserves of Commercial Guaranty CasualtyInsurance
Company, which was contributed to TPC by Citigroup on October 3, 2001. At December 31, 2001, these gross reserves were
$867 million and net reserves were $633 million.
(c) For years prior to 2004, excludes SPC reserves, which were acquired on April 1, 2004. Accordingly, the reserve development
(net reserves for claims and claim adjustment expenses reestimated as of subsequent years less net reserves recorded at the end
of the year, asoriginally estimated) for years prior to 2004 relates only to losses recorded by TPC and does not include reserve
development recorded by SPC. For 2004 and subsequent year, includes SPC reserves and subsequent development recorded by
SPC. At December 31,2004, SPC gross reserves were $23,274 million and net reserves were $15,959 million.