Travelers 2005 Annual Report Download - page 40
Download and view the complete annual report
Please find page 40 of the 2005 Travelers annual report below. You can navigate through the pages in the report by either clicking on the pages listed below, or by using the keyword search tool below to find specific information within the annual report.-
 1
1 -
2
-
3
-
4
-
5
-
6
-
7
-
8
-
9
-
10
-
11
-
12
-
13
-
14
-
15
-
16
-
17
-
18
-
19
-
20
-
21
-
22
-
23
-
24
-
25
-
26
-
27
-
28
-
29
-
 30
30 -
 31
31 -
 32
32 -
 33
33 -
 34
34 -
 35
35 -
 36
36 -
 37
37 -
 38
38 -
 39
39 -
 40
40 -
 41
41 -
 42
42 -
 43
43 -
 44
44 -
 45
45 -
 46
46 -
 47
47 -
 48
48 -
 49
49 -
 50
50 -
51
-
52
-
53
-
54
-
55
-
56
-
57
-
58
-
59
-
60
-
61
-
62
-
63
-
64
-
65
-
66
-
67
-
68
-
69
-
70
-
71
-
72
-
73
-
74
-
75
-
76
-
77
-
78
-
79
-
80
-
81
-
82
-
83
-
84
-
85
-
86
-
87
-
88
-
89
-
90
-
91
-
92
-
93
-
94
-
95
-
96
-
97
-
98
-
99
-
100
-
101
-
102
-
103
-
104
-
105
-
106
-
107
-
108
-
109
-
110
-
111
-
112
-
113
-
114
-
115
-
116
-
117
-
118
-
119
-
120
-
121
-
122
-
123
-
124
-
125
-
126
-
127
-
128
-
129
-
130
-
131
-
132
-
133
-
134
-
135
-
136
-
137
-
138
-
139
-
140
-
141
-
142
-
143
-
144
-
145
-
146
-
147
-
148
-
149
-
150
-
151
-
152
-
153
-
154
-
155
-
156
-
157
-
158
-
159
-
160
-
161
-
162
-
163
-
164
-
165
-
166
-
167
-
168
-
169
-
170
-
171
-
172
-
173
-
174
-
175
-
176
-
177
-
178
-
179
-
180
-
181
-
182
-
183
-
184
-
185
-
186
-
187
-
188
-
189
-
190
-
191
-
192
-
193
-
194
-
195
-
196
-
197
-
198
-
199
-
200
-
201
-
202
-
203
-
204
-
205
-
206
-
207
-
208
-
209
-
210
-
211
-
212
-
213
-
214
-
215
-
216
-
217
-
218
-
219
-
220
-
221
-
222
-
223
-
224
-
225
-
226
-
227
-
228
-
229
-
230
-
231
-
232
-
233
-
234
-
235
-
236
-
237
-
238
-
239
-
240
-
241
-
242
-
243
-
244
-
245
-
246
-
247
-
248
-
249
-
250
-
251
-
252
-
253
-
254
-
255
-
256
-
257
-
258
 |
 |

28
Travelers Lloyds Insurance Company, Travelers Lloyds of Texas Insurance Company, and USF&G
Insurance Company of Mississippi.
(c) The Northland Pool consists of Northland Insurance Company, Northfield Insurance Company,
Northland Casualty Company, Mendota Insurance Company, Mendakota Insurance Company,
American Equity Insurance Company and American Equity Specialty Insurance Company.
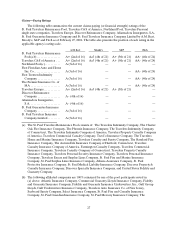
Debt Ratings
The following table summarizes the current debt, preferred stock and commercial paper ratings of the
Company and its subsidiaries by A.M. Best, Moody’s, S&P and Fitch as of February 27, 2006. The table
also presents the position of each ratinginthe applicable agency’s rating scale.
A.M.Best Moody’s S&P Fitch
Senior debt ....... a−(7th of 22) A3 (7th of 21) BBB+ (8th of 22) A − (7th of 22)
Subordinated debt. bbb+ (8th of 22) Baa (8th of 21) BBB (9th of 22) A− (7th of 22)
Junior subordinated
debt ........... bbb+(8th of 22) Baa (8th of 21) BBB− (10th of 22) BBB+ (8th of 22)
Trust preferred
securities....... bbb (9th of 22) Baa (8th of 21) BBB− (10th of 22) BBB+ (8th of 22)
Preferred stock... bbb (9th of 22) Baa2 (9th of 21) BBB− (10th of 22) BBB+ (8th of 22)
Commercial paper. AMB-1 (2nd of 6) Prime-2 (2nd of 4) A-2 (3rd of8)F-2 (3rd of 8)
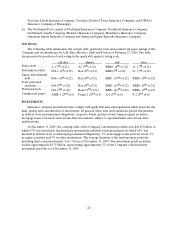
INVESTMENTS
Insurance company investments must comply with applicable laws and regulations which prescribe the
kind, quality and concentration of investments. In general, these laws and regulations permit investments
in federal, state and municipal obligations, corporate bonds, preferred and common equity securities,
mortgage loans, real estate and certain other investments, subject tospecified limits and certain other
qualifications.
At December 31, 2005, the carrying value of the Company’s investment portfolio was $68.29 billion, of
which93% was invested in fixed maturity investments and short-term investments (of which 60% was
invested in federal, state or municipal government obligations), 1% in mortgage loans and real estate, 1%
in equity securities and 5% in other investments. The average duration of the fixed maturity portfolio,
including short-term investments, was 3.9 years at December 31, 2005. Non-investment grade securities
totaled approximately $1.75 billion, representing approximately 3% of the Company’s fixed maturity
investment portfolio as of December 31, 2005.