Travelers 2005 Annual Report Download - page 136
Download and view the complete annual report
Please find page 136 of the 2005 Travelers annual report below. You can navigate through the pages in the report by either clicking on the pages listed below, or by using the keyword search tool below to find specific information within the annual report.-
 1
1 -
2
-
3
-
4
-
5
-
6
-
7
-
8
-
9
-
10
-
11
-
12
-
13
-
14
-
15
-
16
-
17
-
18
-
19
-
20
-
21
-
22
-
23
-
24
-
25
-
26
-
27
-
28
-
29
-
30
-
31
-
32
-
33
-
34
-
35
-
36
-
37
-
38
-
39
-
40
-
41
-
42
-
43
-
44
-
45
-
46
-
47
-
48
-
49
-
50
-
51
-
52
-
53
-
54
-
55
-
56
-
57
-
58
-
59
-
60
-
61
-
62
-
63
-
64
-
65
-
66
-
67
-
68
-
69
-
70
-
71
-
72
-
73
-
74
-
75
-
76
-
77
-
78
-
79
-
80
-
81
-
82
-
83
-
84
-
85
-
86
-
87
-
88
-
89
-
90
-
91
-
92
-
93
-
94
-
95
-
96
-
97
-
98
-
99
-
100
-
101
-
102
-
103
-
104
-
105
-
106
-
107
-
108
-
109
-
110
-
111
-
112
-
113
-
114
-
115
-
116
-
117
-
118
-
119
-
120
-
121
-
122
-
123
-
124
-
125
-
 126
126 -
 127
127 -
 128
128 -
 129
129 -
 130
130 -
 131
131 -
 132
132 -
 133
133 -
 134
134 -
 135
135 -
 136
136 -
 137
137 -
 138
138 -
 139
139 -
 140
140 -
 141
141 -
 142
142 -
 143
143 -
 144
144 -
 145
145 -
 146
146 -
147
-
148
-
149
-
150
-
151
-
152
-
153
-
154
-
155
-
156
-
157
-
158
-
159
-
160
-
161
-
162
-
163
-
164
-
165
-
166
-
167
-
168
-
169
-
170
-
171
-
172
-
173
-
174
-
175
-
176
-
177
-
178
-
179
-
180
-
181
-
182
-
183
-
184
-
185
-
186
-
187
-
188
-
189
-
190
-
191
-
192
-
193
-
194
-
195
-
196
-
197
-
198
-
199
-
200
-
201
-
202
-
203
-
204
-
205
-
206
-
207
-
208
-
209
-
210
-
211
-
212
-
213
-
214
-
215
-
216
-
217
-
218
-
219
-
220
-
221
-
222
-
223
-
224
-
225
-
226
-
227
-
228
-
229
-
230
-
231
-
232
-
233
-
234
-
235
-
236
-
237
-
238
-
239
-
240
-
241
-
242
-
243
-
244
-
245
-
246
-
247
-
248
-
249
-
250
-
251
-
252
-
253
-
254
-
255
-
256
-
257
-
258
 |
 |

124
•whether ornot the valuations have declined significantly in the entity’s market sector;
•whether or not the internal valuation committee believes it is probable that the issuer will need
financing within six months at a lower price than our carrying value; and
•whether ornot we have the ability and intent to hold the security for a period of time sufficient to
allow for recovery, enabling us to receive value equal to or greater than our cost.
The quarterly valuation procedures described above are in addition to the portfolio managers’
ongoing responsibility to frequently monitor developments affecting those invested assets, paying
particular attention to events that might give rise to impairment write-downs.
The Company manages the portfolio to maximize long-term return, evaluating current market
conditions and the future outlook for the entities in which it has invested. Because this portfolio primarily
consists of privately-held, early-stage venture investments, events giving rise to impairment can occur in a
brief period of time (e.g., the entity has been unsuccessful in securing additional financing, other investors
decide to withdraw their support, complications arise in the product development process, etc.), and
decisions are made at that point in time, based on the specific facts and circumstances, with respect to a
recognition of “other-than-temporary” impairment or sale of the investment.
Non-Publicly TradedInvestments
The Company’s investmentportfolio includes non-publicly traded investments, such as venture capital
investments, private equity limited partnerships, joint ventures, other limited partnerships, and certain
fixed income securities. Certain venture capital investments that are controlled by the Company are
consolidated in the Company’s financial statements. The Company uses the equity method of accounting
for joint ventures, limited partnerships and certain private equity securities. Certain other private equity
investments,including venture capital investments, are not subject to the provisions of Statement of
Financial Accounting Standards (FAS) No. 115, Accounting for Certain Investments in Debt and Equity
Securities, but are reported at estimated fair value in accordance with FAS 60, Accounting and Reporting by
Insurance Enterprises. The fair value of the venture capital investments is based on an estimate determined
by an internal valuation committee for securities for which there is no public market. The internal
valuation committee reviews such factors as recent filings, operating results, balance sheet stability, growth,
and other business and market sector fundamental statistics in estimating fair values of specific
investments. Other non-publicly traded securities are valued based on factors such as management
judgment, recent financial information and other market data. An impairment loss is recognized if, based
on the specific facts and circumstances, it is probable that the Company will not be able to recover all of
the cost of an individual holding.
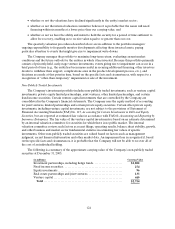
The following is a summary of the approximate carrying value of the Company’s non-publicly traded
securities at December 31, 2005:
(in millions) Carrying Value
Investment partnerships, including hedge funds. .................... $ 1,802
Fixed income securities.......................................... 274
Equity investments.............................................. 96
Real estate partnerships and jointventures. ........................ 133
Venture capital................................................. 449
Total ........................................................ $ 2,754