Travelers 2005 Annual Report Download - page 90
Download and view the complete annual report
Please find page 90 of the 2005 Travelers annual report below. You can navigate through the pages in the report by either clicking on the pages listed below, or by using the keyword search tool below to find specific information within the annual report.-
 1
1 -
2
-
3
-
4
-
5
-
6
-
7
-
8
-
9
-
10
-
11
-
12
-
13
-
14
-
15
-
16
-
17
-
18
-
19
-
20
-
21
-
22
-
23
-
24
-
25
-
26
-
27
-
28
-
29
-
30
-
31
-
32
-
33
-
34
-
35
-
36
-
37
-
38
-
39
-
40
-
41
-
42
-
43
-
44
-
45
-
46
-
47
-
48
-
49
-
50
-
51
-
52
-
53
-
54
-
55
-
56
-
57
-
58
-
59
-
60
-
61
-
62
-
63
-
64
-
65
-
66
-
67
-
68
-
69
-
70
-
71
-
72
-
73
-
74
-
75
-
76
-
77
-
78
-
79
-
 80
80 -
 81
81 -
 82
82 -
 83
83 -
 84
84 -
 85
85 -
 86
86 -
 87
87 -
 88
88 -
 89
89 -
 90
90 -
 91
91 -
 92
92 -
 93
93 -
 94
94 -
 95
95 -
 96
96 -
 97
97 -
 98
98 -
 99
99 -
 100
100 -
101
-
102
-
103
-
104
-
105
-
106
-
107
-
108
-
109
-
110
-
111
-
112
-
113
-
114
-
115
-
116
-
117
-
118
-
119
-
120
-
121
-
122
-
123
-
124
-
125
-
126
-
127
-
128
-
129
-
130
-
131
-
132
-
133
-
134
-
135
-
136
-
137
-
138
-
139
-
140
-
141
-
142
-
143
-
144
-
145
-
146
-
147
-
148
-
149
-
150
-
151
-
152
-
153
-
154
-
155
-
156
-
157
-
158
-
159
-
160
-
161
-
162
-
163
-
164
-
165
-
166
-
167
-
168
-
169
-
170
-
171
-
172
-
173
-
174
-
175
-
176
-
177
-
178
-
179
-
180
-
181
-
182
-
183
-
184
-
185
-
186
-
187
-
188
-
189
-
190
-
191
-
192
-
193
-
194
-
195
-
196
-
197
-
198
-
199
-
200
-
201
-
202
-
203
-
204
-
205
-
206
-
207
-
208
-
209
-
210
-
211
-
212
-
213
-
214
-
215
-
216
-
217
-
218
-
219
-
220
-
221
-
222
-
223
-
224
-
225
-
226
-
227
-
228
-
229
-
230
-
231
-
232
-
233
-
234
-
235
-
236
-
237
-
238
-
239
-
240
-
241
-
242
-
243
-
244
-
245
-
246
-
247
-
248
-
249
-
250
-
251
-
252
-
253
-
254
-
255
-
256
-
257
-
258
 |
 |
78
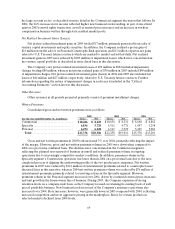
Overview
Operating income of $679 million in 2005 improved by $1.33 billion over the operating loss of
$648 million in 2004. The significant improvement in 2005 operating income reflected the absence of net
unfavorable prior year reserve development, as well as strong net investment income, improved current
accident year results in several domestic businesses (particularly Bond) and lower commission expenses in
certain business units. Operating results in 2005 included a cost of catastrophes of $356 million (net of
reinsurance and including reinstatement premiums), compared with $220 million of such costs in 2004. The
operating loss of $648 million in2004was driven by net unfavorable prior year reserve development of
$1.43 billion, including significant charges related to the construction and surety reserves acquired in the
merger, as well as other reserving actions that are described in the narrative that follows. Operating results
in 2004 also included $220 million for the cost of catastrophes resulting from the four hurricanes described
previously, whereas 2003 results included no catastrophe losses.
Earned Premiums
Earned premiums in 2005 increased $1.10 billion, or 24%, over 2004, primarily reflecting the impact of
the merger. Earned premiums in 2005 were reduced by the $48 million in reinstatement premiums related
to the hurricane losses described in the “Consolidated Overview” section herein. Earned premiums in 2005
also reflected the inclusion of one additional month ofpremium volume totaling $37 million to eliminate a
reporting lag at the Company’s operations at Lloyd’s, the impact of which was partially offset by the sale of
certain classes of personal insurance business at those Lloyd’s operations. Earned premiums in 2004 were
reduced by $76 million of reinstatement premiums primarily related to a reserve charge in the Company’s
Bond operation. Earned premiums of $4.64 billion in 2004 grew $3.47 billion over 2003, primarily
reflecting the impact of the merger
Net Investment Income
Refer to the “Net Investment Income” section of the “Consolidated Results of Operations” discussion
herein for a description of the factors contributing to the increase in the Company’s net investment income
in 2005and 2004.
Claims and Expenses
Claims and claims adjustment expenses in 2005 included $308 million of current year catastrophe
losses, compared with catastrophe losses of $209 million recorded in 2004. Catastrophe losses in both
periods were driven by the hurricanes described in the “Consolidated Overview” section herein. Net
favorable prior year reserve development in 2005 totaled $9 million, as favorable development in
International operations was largely offset by unfavorable development related to 2004 hurricane losses in
the Personal Catastrophe Risk operation. Net unfavorable prior year reserve development totaled
$1.43 billion in 2004, which included charges to increase the estimate of the acquired net construction
reserves by $500 million and the acquired net surety reserves in the Company’s Bond operation by $300
million, as well as a $252 million charge related to the financial condition of a construction contractor. The
following discussion provides more information regarding the net unfavorable prior year loss development
related to these items in 2004, as well as other reserving actions.
Upon having access to each company’s detailed policyholder information,including underwriting,
claim, and actuarial files on April 1, 2004, in connection with the closing of the merger, the Company was
able to begin the detailed process of developing a uniform and consistent approach to estimating the
combined company’s loss reserves. As part of that process, a team of actuaries representing the historical
actuarial perspectives, judgments and methods applied by each legacy company, discussed their views,
methodologies, and analysis of available data.