Travelers 2005 Annual Report Download - page 82
Download and view the complete annual report
Please find page 82 of the 2005 Travelers annual report below. You can navigate through the pages in the report by either clicking on the pages listed below, or by using the keyword search tool below to find specific information within the annual report.-
 1
1 -
2
-
3
-
4
-
5
-
6
-
7
-
8
-
9
-
10
-
11
-
12
-
13
-
14
-
15
-
16
-
17
-
18
-
19
-
20
-
21
-
22
-
23
-
24
-
25
-
26
-
27
-
28
-
29
-
30
-
31
-
32
-
33
-
34
-
35
-
36
-
37
-
38
-
39
-
40
-
41
-
42
-
43
-
44
-
45
-
46
-
47
-
48
-
49
-
50
-
51
-
52
-
53
-
54
-
55
-
56
-
57
-
58
-
59
-
60
-
61
-
62
-
63
-
64
-
65
-
66
-
67
-
68
-
69
-
70
-
71
-
 72
72 -
 73
73 -
 74
74 -
 75
75 -
 76
76 -
 77
77 -
 78
78 -
 79
79 -
 80
80 -
 81
81 -
 82
82 -
 83
83 -
 84
84 -
 85
85 -
 86
86 -
 87
87 -
 88
88 -
 89
89 -
 90
90 -
 91
91 -
 92
92 -
93
-
94
-
95
-
96
-
97
-
98
-
99
-
100
-
101
-
102
-
103
-
104
-
105
-
106
-
107
-
108
-
109
-
110
-
111
-
112
-
113
-
114
-
115
-
116
-
117
-
118
-
119
-
120
-
121
-
122
-
123
-
124
-
125
-
126
-
127
-
128
-
129
-
130
-
131
-
132
-
133
-
134
-
135
-
136
-
137
-
138
-
139
-
140
-
141
-
142
-
143
-
144
-
145
-
146
-
147
-
148
-
149
-
150
-
151
-
152
-
153
-
154
-
155
-
156
-
157
-
158
-
159
-
160
-
161
-
162
-
163
-
164
-
165
-
166
-
167
-
168
-
169
-
170
-
171
-
172
-
173
-
174
-
175
-
176
-
177
-
178
-
179
-
180
-
181
-
182
-
183
-
184
-
185
-
186
-
187
-
188
-
189
-
190
-
191
-
192
-
193
-
194
-
195
-
196
-
197
-
198
-
199
-
200
-
201
-
202
-
203
-
204
-
205
-
206
-
207
-
208
-
209
-
210
-
211
-
212
-
213
-
214
-
215
-
216
-
217
-
218
-
219
-
220
-
221
-
222
-
223
-
224
-
225
-
226
-
227
-
228
-
229
-
230
-
231
-
232
-
233
-
234
-
235
-
236
-
237
-
238
-
239
-
240
-
241
-
242
-
243
-
244
-
245
-
246
-
247
-
248
-
249
-
250
-
251
-
252
-
253
-
254
-
255
-
256
-
257
-
258
 |
 |
70
In the first quarter of 2005, the Company implemented changes in the timing and structure of
reinsurance purchased in the Specialty segment. The change in structure resulted in an increase in ceded
premiums in 2005 when compared with 2004. The Company also made a modest adjustment to 2004 ceded
written premiums to report at inception all ceded written premiums for reinsurance agreements that have
minimum amounts required to be ceded. Previously, ceded written premiums for certain of these
agreements were reported over the life of the contracts. This adjustment affected only the statistical
disclosure of net written premiums on a quarter-by-quarter basis; it did not affect net written premium
amounts over the lives of the respective agreements, nor did it impact gross written premiums, earned
premiums, operating results or capital. The adjustment was made to conform the statistical measurement
of production—net written premiums—across the Company’s businesses.
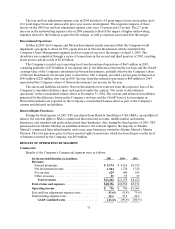
The $5.81 billion, or 44%, increase in consolidated net written premiums in 2004 compared with 2003
primarily reflected the impact of the merger. On a pro forma combined basis, net written premiums in
2004 were level with 2003. Business retention levels in the majority of the Company’s insurance operations
remained consistent with 2003 levels. The level of rate increases, however, continued to decline during
2004, reflecting the increasingly competitive marketplace. New business volume in the Commercial and
Specialty segments in 2004 declined when compared with the combined new business volume of SPC and
TPC in the prior year, reflecting the competitive marketplace and the impact of new business premiums in
2003 from renewal rights transactions. The non-renewal of certain commercial property, construction and
surety risks as well as certain personal lines business in the Company’s operations at Lloyd’s also negatively
impacted premium volume in 2004. Personal net written premiums increased 17% in2004 over 2003, due
to strong organic growth, new business resulting from a renewal rights transaction, strong business
retention levels and price increases.
Claims and expenses
Claims and Claim Adjustment Expenses
Claims and claim adjustment expenses of $14.93 billion in 2005 were $512 million lower than the 2004
total of $15.44 billion. The 2005 total included $2.03 billion of catastrophe losses, compared with
$761 million of such losses in 2004. The cost of catastrophes is discussed in more detail in the following
narrative. The 2005 total also included $325 million of net unfavorable prior year reserve development,
comparedwith $2.39 billion of netunfavorableprior year reserve development in 2004. The net
unfavorable prior year reserve development in 2005 was concentrated in the Commercial segment and was
primarily the result of a charge to increase asbestos reserves as a result of the Company’s annual asbestos
liability review. That charge was partially offset by other, non-asbestos related, net favorable prior year
development in the Personal and Commercial segments. Claims and claim adjustment expenses in 2005
also reflected improvement in current accident year non-catastrophe related loss experience as compared
with 2004.
Claims and claim adjustment expenses of $15.44 billion in 2004 were $6.32 billion higher than the
comparable 2003 total, primarily reflecting the impact of the merger. The 2004 net unfavorable prior year
reserve development of $2.39 billion included a $928 million charge to increase asbestos reserves, a
$290 million charge to increase environmental reserves, a charge of $252 million related to the financial
condition of a specific construction contractor, and charges to increase Construction and Surety reserves in
the Specialty segment by $500 million and $300million, respectively. The Company also commuted certain
reinsurance agreements with a major reinsurer in 2004 resulting in a $113 million prior year reserve charge
(in addition to a current year loss of $40 million). Commutationsare a complete and final settlement with a
reinsurer that results in a discharge of all obligations of the parties to the terminated reinsurance
agreement. These and other components of 2004 unfavorable prior year reserve development are
described in more detail in the segment discussions that follow. Net unfavorable prior year reserve
development in 2003 totaled $476 million and was primarily the result of reserve strengthening at the