Travelers 2005 Annual Report Download - page 106
Download and view the complete annual report
Please find page 106 of the 2005 Travelers annual report below. You can navigate through the pages in the report by either clicking on the pages listed below, or by using the keyword search tool below to find specific information within the annual report.-
 1
1 -
2
-
3
-
4
-
5
-
6
-
7
-
8
-
9
-
10
-
11
-
12
-
13
-
14
-
15
-
16
-
17
-
18
-
19
-
20
-
21
-
22
-
23
-
24
-
25
-
26
-
27
-
28
-
29
-
30
-
31
-
32
-
33
-
34
-
35
-
36
-
37
-
38
-
39
-
40
-
41
-
42
-
43
-
44
-
45
-
46
-
47
-
48
-
49
-
50
-
51
-
52
-
53
-
54
-
55
-
56
-
57
-
58
-
59
-
60
-
61
-
62
-
63
-
64
-
65
-
66
-
67
-
68
-
69
-
70
-
71
-
72
-
73
-
74
-
75
-
76
-
77
-
78
-
79
-
80
-
81
-
82
-
83
-
84
-
85
-
86
-
87
-
88
-
89
-
90
-
91
-
92
-
93
-
94
-
95
-
 96
96 -
 97
97 -
 98
98 -
 99
99 -
 100
100 -
 101
101 -
 102
102 -
 103
103 -
 104
104 -
 105
105 -
 106
106 -
 107
107 -
 108
108 -
 109
109 -
 110
110 -
 111
111 -
 112
112 -
 113
113 -
 114
114 -
 115
115 -
 116
116 -
117
-
118
-
119
-
120
-
121
-
122
-
123
-
124
-
125
-
126
-
127
-
128
-
129
-
130
-
131
-
132
-
133
-
134
-
135
-
136
-
137
-
138
-
139
-
140
-
141
-
142
-
143
-
144
-
145
-
146
-
147
-
148
-
149
-
150
-
151
-
152
-
153
-
154
-
155
-
156
-
157
-
158
-
159
-
160
-
161
-
162
-
163
-
164
-
165
-
166
-
167
-
168
-
169
-
170
-
171
-
172
-
173
-
174
-
175
-
176
-
177
-
178
-
179
-
180
-
181
-
182
-
183
-
184
-
185
-
186
-
187
-
188
-
189
-
190
-
191
-
192
-
193
-
194
-
195
-
196
-
197
-
198
-
199
-
200
-
201
-
202
-
203
-
204
-
205
-
206
-
207
-
208
-
209
-
210
-
211
-
212
-
213
-
214
-
215
-
216
-
217
-
218
-
219
-
220
-
221
-
222
-
223
-
224
-
225
-
226
-
227
-
228
-
229
-
230
-
231
-
232
-
233
-
234
-
235
-
236
-
237
-
238
-
239
-
240
-
241
-
242
-
243
-
244
-
245
-
246
-
247
-
248
-
249
-
250
-
251
-
252
-
253
-
254
-
255
-
256
-
257
-
258
 |
 |

94
be fully controlled, particularly when interest rates move dramatically, the investment process generally
favors securities that control this risk within expected interest rate ranges. The Company does invest in
other types of CMO tranches if a careful assessment indicates a favorable risk/return tradeoff. The
Company does not purchase residual interests in CMOs.
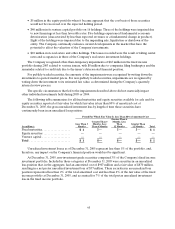
At December 31, 2005 and 2004, the Company held CMOs classified as available for sale with a fair
value of $3.43 billion and $3.30 billion, respectively (excluding Commercial Mortgage-Backed Securities of
$1.16 billion and $953 million, respectively). Approximately 43% and 53% of the Company’s CMO
holdings are guaranteed by or fully collateralized by securities issued by GNMA, FNMA or FHLMC at
December 31, 2005 and 2004, respectively. In addition, the Company held $4.83 billion and $4.66 billion of
GNMA, FNMA, FHLMC or FHA mortgage-backed pass-through securities classified as available for sale
at December 31, 2005 and 2004, respectively. Virtually all of these securities are rated Aaa.
The Company’s real estate investments include warehouses and office buildings and other commercial
land and properties that are directly owned. The Company’s other investments primarily comprise venture
capital, through direct ownership and limited partnerships, private equity limited partnerships, joint
ventures, other limited partnerships and trading securities, which are subject to more volatility than the
Company’s fixed income investments, buthistorically have provided a higher return. At December 31, 2005
and 2004, the carrying value of the Company’s other investments was $3.03 billion and $3.43 billion,
respectively.
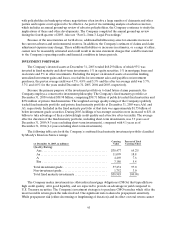
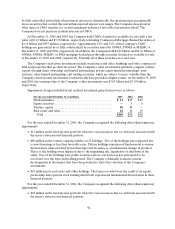
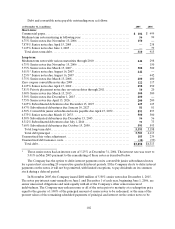
Impairment charges included in net realized investment gains (losses) were as follows:
(for the year ended December 31, in millions) 2005 2004 2003
Fixed maturities ......................................... $ 11$25 $65
Equitysecurities......................................... —5 6
Venture capital.......................................... 8040 —
Real estate and other. .................................... 1810 19
Total................................................. $ 1 09 $80 $90
For the year ended December 31, 2005, the Company recognized the following other-than-temporary
impairments:
•$11million in the fixed income portfolio related to various issuers due to credit risk associated with
the issuer’s deteriorated financial position.
•$80million in the venture capital portfolio on 22 holdings. Two of the holdings were impaired due
to new financings at less than favorable rates. Fifteen holdings experienced fundamental economic
deterioration (characterized by less than expected revenues or a fundamental change in product).
Three of the holdings were impaired due to the impending sale, liquidation or shutdown of the
entity. Two of the holdings were public securities whose cost basis was not anticipated to be
recovered over the expected holding period. The Company continually evaluates current
developments in the market that have the potential to affect the valuation of the Company’s
investments.
•$18 million inits real estate and other holdings. The losses recorded were the result of an equity
partnership and a private stock holding which both experienced fundamental deterioration in their
financial position.
For the year ended December 31, 2004, the Company recognized the following other-than-temporary
impairments:
•$25million in the fixed income portfolio related to various issuers due to credit risk associated with
the issuer’s deteriorated financial position.