Travelers 2005 Annual Report Download - page 28
Download and view the complete annual report
Please find page 28 of the 2005 Travelers annual report below. You can navigate through the pages in the report by either clicking on the pages listed below, or by using the keyword search tool below to find specific information within the annual report.-
 1
1 -
2
-
3
-
4
-
5
-
6
-
7
-
8
-
9
-
10
-
11
-
12
-
13
-
14
-
15
-
16
-
17
-
 18
18 -
 19
19 -
 20
20 -
 21
21 -
 22
22 -
 23
23 -
 24
24 -
 25
25 -
 26
26 -
 27
27 -
 28
28 -
 29
29 -
 30
30 -
 31
31 -
 32
32 -
 33
33 -
 34
34 -
 35
35 -
 36
36 -
 37
37 -
 38
38 -
39
-
40
-
41
-
42
-
43
-
44
-
45
-
46
-
47
-
48
-
49
-
50
-
51
-
52
-
53
-
54
-
55
-
56
-
57
-
58
-
59
-
60
-
61
-
62
-
63
-
64
-
65
-
66
-
67
-
68
-
69
-
70
-
71
-
72
-
73
-
74
-
75
-
76
-
77
-
78
-
79
-
80
-
81
-
82
-
83
-
84
-
85
-
86
-
87
-
88
-
89
-
90
-
91
-
92
-
93
-
94
-
95
-
96
-
97
-
98
-
99
-
100
-
101
-
102
-
103
-
104
-
105
-
106
-
107
-
108
-
109
-
110
-
111
-
112
-
113
-
114
-
115
-
116
-
117
-
118
-
119
-
120
-
121
-
122
-
123
-
124
-
125
-
126
-
127
-
128
-
129
-
130
-
131
-
132
-
133
-
134
-
135
-
136
-
137
-
138
-
139
-
140
-
141
-
142
-
143
-
144
-
145
-
146
-
147
-
148
-
149
-
150
-
151
-
152
-
153
-
154
-
155
-
156
-
157
-
158
-
159
-
160
-
161
-
162
-
163
-
164
-
165
-
166
-
167
-
168
-
169
-
170
-
171
-
172
-
173
-
174
-
175
-
176
-
177
-
178
-
179
-
180
-
181
-
182
-
183
-
184
-
185
-
186
-
187
-
188
-
189
-
190
-
191
-
192
-
193
-
194
-
195
-
196
-
197
-
198
-
199
-
200
-
201
-
202
-
203
-
204
-
205
-
206
-
207
-
208
-
209
-
210
-
211
-
212
-
213
-
214
-
215
-
216
-
217
-
218
-
219
-
220
-
221
-
222
-
223
-
224
-
225
-
226
-
227
-
228
-
229
-
230
-
231
-
232
-
233
-
234
-
235
-
236
-
237
-
238
-
239
-
240
-
241
-
242
-
243
-
244
-
245
-
246
-
247
-
248
-
249
-
250
-
251
-
252
-
253
-
254
-
255
-
256
-
257
-
258
 |
 |

16
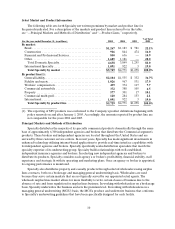
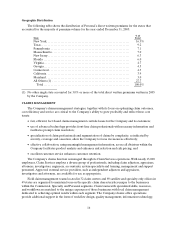
Geographic Distribution
The following table shows the distribution of Personal’s direct written premiums for the states that
accounted for the majority of premium volume for the year ended December 31, 2005:
State
% of
Total
New York........................................................... 16.3%
Texas. .............................................................. 9.2
Pennsylvania ........................................................ 7.1
Massachusetts ....................................................... 7.0
New Jersey.......................................................... 6.3
Florida ............................................................. 6.0
Virginia............................................................. 4.7
Georgia............................................................. 4.5
Connecticut......................................................... 4.3
California ........................................................... 3.9
Maryland ........................................................... 3.0
All Others (1)....................................................... 27.7
Total............................................................. 100.0%
(1) No other single state accounted for 3.0% or more of the total direct written premiums written in2005
by the Company.
CLAIMS MANAGEMENT
The Company’s claims management strategies, together with its focus on optimizing claim outcomes,
cost efficiency and service are critical to the Company’s ability to grow profitably and reflect these core
tenets:
•fair, efficient, fact-based claims management controls losses for the Company and its customers;
•use of advanced technology provides front-lineclaim professionals with necessary information and
facilitates prompt claim resolution;
•specialization of claim professionals and segmentation of claims by complexity, as indicated by
severity, coverage and causation, allow the Company to focus its resources effectively;
•effective collaboration, using meaningful management information, across all divisions within the
Company facilitates product analysis and enhances risk selection and risk pricing; and
•excellent customer service enhances customer retention.
The Company’s claims function is managed through its Claim Services operations. With nearly 13,000
employees, Claim Services employs a diverse group of professionals, including claim adjusters, appraisers,
attorneys, investigators, engineers, accountants, system specialists and training, management and support
personnel. Approved external service providers, such as independent adjusters and appraisers,
investigators and attorneys, are available for use as appropriate.
Field claim management teams located in 32 claim centers and 89 satellite and specialty-only offices in
49 states are organized to maintain focus on the specific claim characteristics unique to the businesses
within the Commercial, Specialty and Personal segments. Claim teams with specialized skills, resources,
and workflows are matched to the unique exposures of those businesses with local claim management
dedicated to achieving optimal results within each segment. The Company’s home office operations
provide additional support in the form of workflow design, quality management, information technology,