Travelers 2005 Annual Report Download - page 15
Download and view the complete annual report
Please find page 15 of the 2005 Travelers annual report below. You can navigate through the pages in the report by either clicking on the pages listed below, or by using the keyword search tool below to find specific information within the annual report.-
 1
1 -
2
-
3
-
4
-
 5
5 -
 6
6 -
 7
7 -
 8
8 -
 9
9 -
 10
10 -
 11
11 -
 12
12 -
 13
13 -
 14
14 -
 15
15 -
 16
16 -
 17
17 -
 18
18 -
 19
19 -
 20
20 -
 21
21 -
 22
22 -
 23
23 -
 24
24 -
 25
25 -
26
-
27
-
28
-
29
-
30
-
31
-
32
-
33
-
34
-
35
-
36
-
37
-
38
-
39
-
40
-
41
-
42
-
43
-
44
-
45
-
46
-
47
-
48
-
49
-
50
-
51
-
52
-
53
-
54
-
55
-
56
-
57
-
58
-
59
-
60
-
61
-
62
-
63
-
64
-
65
-
66
-
67
-
68
-
69
-
70
-
71
-
72
-
73
-
74
-
75
-
76
-
77
-
78
-
79
-
80
-
81
-
82
-
83
-
84
-
85
-
86
-
87
-
88
-
89
-
90
-
91
-
92
-
93
-
94
-
95
-
96
-
97
-
98
-
99
-
100
-
101
-
102
-
103
-
104
-
105
-
106
-
107
-
108
-
109
-
110
-
111
-
112
-
113
-
114
-
115
-
116
-
117
-
118
-
119
-
120
-
121
-
122
-
123
-
124
-
125
-
126
-
127
-
128
-
129
-
130
-
131
-
132
-
133
-
134
-
135
-
136
-
137
-
138
-
139
-
140
-
141
-
142
-
143
-
144
-
145
-
146
-
147
-
148
-
149
-
150
-
151
-
152
-
153
-
154
-
155
-
156
-
157
-
158
-
159
-
160
-
161
-
162
-
163
-
164
-
165
-
166
-
167
-
168
-
169
-
170
-
171
-
172
-
173
-
174
-
175
-
176
-
177
-
178
-
179
-
180
-
181
-
182
-
183
-
184
-
185
-
186
-
187
-
188
-
189
-
190
-
191
-
192
-
193
-
194
-
195
-
196
-
197
-
198
-
199
-
200
-
201
-
202
-
203
-
204
-
205
-
206
-
207
-
208
-
209
-
210
-
211
-
212
-
213
-
214
-
215
-
216
-
217
-
218
-
219
-
220
-
221
-
222
-
223
-
224
-
225
-
226
-
227
-
228
-
229
-
230
-
231
-
232
-
233
-
234
-
235
-
236
-
237
-
238
-
239
-
240
-
241
-
242
-
243
-
244
-
245
-
246
-
247
-
248
-
249
-
250
-
251
-
252
-
253
-
254
-
255
-
256
-
257
-
258
 |
 |

3
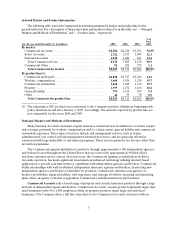
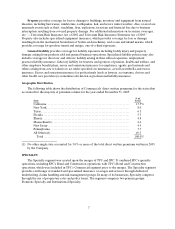
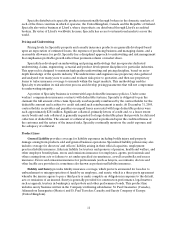
Selected Market and Product Information
The followingtable sets forth Commercial net writtenpremiums by market and product line for the
periods indicated. For a description of the product lines and markets referred to in the table,see “—Principal
Markets and Methods ofDistribution” and “—Product Lines,” respectively.
(for the year ended December 31, in millions) 2005 2004 2003
% of
Total
2005
By market:
Commercial Accounts .................................... $4,386 $4,210 $3,251
52.0%
Select Accounts .......................................... 2,722 2,555 2,047
32.3
National Accounts ....................................... 1,230 1,040 831
14.6
Total Commercial Core................................. 8,338 7,805 6,129
98.9
Commercial Other....................................... 91 506 733
1.1
Total Commercialby market............................ $8,429 $8,311 $6,862
100.0%
By product line(1):
Commercial multi-peril ................................... $2,890 $2,517 $2,246
34.3
Workers’ compensation................................... 1,660 1,530 1,234
19.7
Commercial automobile .................................. 1,660 1,609 1,313
19.7
Property ................................................ 1,399 1,472 1,166
16.6
General liability. ......................................... 774 1,130 833
9.2
Other. .................................................. 46 53 70
0.5
Total Commercial by product line........................ $8,429 $8,311 $6,862
100.0%
(1) The reporting of SPC products was conformed to the Company’s product definitions beginning with
policy renewals on and after January 1, 2005. Accordingly, the amounts reported by product line are
not comparable for the years 2004 and 2005.
Principal Markets and Methodsof Distribution
Many National Accounts customers require insurance-related services in addition to or in lieu of pure
risk coverage, primarily for workers’ compensation and, to a lesser extent, general liability and commercial
automobile exposures. These types of services include risk management services, such as claims
administration, loss control and risk management information services, and are generally offered in
connection with large deductible or self-insured programs. These services generate fee income rather than
net written premiums.
The Commercial segment distributes its products through approximately 6,300 independent agencies
and brokers located throughout the United States that are serviced by approximately 90 field offices
and three customer service centers. In recent years, the Commercial segment, particularly in its Select
Accounts operation, has made significant investments in enhanced technology utilizing internet-based
applications to provide real-time interface capabilities with independent agencies and brokers. Commercial
builds relationships with well-established, independent insurance agencies and brokers. In selecting new
independent agencies and brokers to distribute its products, Commercial considers each agency’s or
broker’s profitability, financial stability, staff experience and strategic fit with its operating and marketing
plans. Once an agency or broker is appointed, Commercial carefully monitors its performance.
Commercial Accounts sells a broad range of property and casualty insurance products through a large
network of independent agents and brokers. Commercial Accounts’ casualty products primarily target mid-
sized businesses with 50 to 1,000 employees, while its property products target large and mid-sized
businesses. The Company offers a full lineof products to its Commercial Accounts customers with an