Travelers 2005 Annual Report Download - page 168
Download and view the complete annual report
Please find page 168 of the 2005 Travelers annual report below. You can navigate through the pages in the report by either clicking on the pages listed below, or by using the keyword search tool below to find specific information within the annual report.-
 1
1 -
2
-
3
-
4
-
5
-
6
-
7
-
8
-
9
-
10
-
11
-
12
-
13
-
14
-
15
-
16
-
17
-
18
-
19
-
20
-
21
-
22
-
23
-
24
-
25
-
26
-
27
-
28
-
29
-
30
-
31
-
32
-
33
-
34
-
35
-
36
-
37
-
38
-
39
-
40
-
41
-
42
-
43
-
44
-
45
-
46
-
47
-
48
-
49
-
50
-
51
-
52
-
53
-
54
-
55
-
56
-
57
-
58
-
59
-
60
-
61
-
62
-
63
-
64
-
65
-
66
-
67
-
68
-
69
-
70
-
71
-
72
-
73
-
74
-
75
-
76
-
77
-
78
-
79
-
80
-
81
-
82
-
83
-
84
-
85
-
86
-
87
-
88
-
89
-
90
-
91
-
92
-
93
-
94
-
95
-
96
-
97
-
98
-
99
-
100
-
101
-
102
-
103
-
104
-
105
-
106
-
107
-
108
-
109
-
110
-
111
-
112
-
113
-
114
-
115
-
116
-
117
-
118
-
119
-
120
-
121
-
122
-
123
-
124
-
125
-
126
-
127
-
128
-
129
-
130
-
131
-
132
-
133
-
134
-
135
-
136
-
137
-
138
-
139
-
140
-
141
-
142
-
143
-
144
-
145
-
146
-
147
-
148
-
149
-
150
-
151
-
152
-
153
-
154
-
155
-
156
-
157
-
 158
158 -
 159
159 -
 160
160 -
 161
161 -
 162
162 -
 163
163 -
 164
164 -
 165
165 -
 166
166 -
 167
167 -
 168
168 -
 169
169 -
 170
170 -
 171
171 -
 172
172 -
 173
173 -
 174
174 -
 175
175 -
 176
176 -
 177
177 -
 178
178 -
179
-
180
-
181
-
182
-
183
-
184
-
185
-
186
-
187
-
188
-
189
-
190
-
191
-
192
-
193
-
194
-
195
-
196
-
197
-
198
-
199
-
200
-
201
-
202
-
203
-
204
-
205
-
206
-
207
-
208
-
209
-
210
-
211
-
212
-
213
-
214
-
215
-
216
-
217
-
218
-
219
-
220
-
221
-
222
-
223
-
224
-
225
-
226
-
227
-
228
-
229
-
230
-
231
-
232
-
233
-
234
-
235
-
236
-
237
-
238
-
239
-
240
-
241
-
242
-
243
-
244
-
245
-
246
-
247
-
248
-
249
-
250
-
251
-
252
-
253
-
254
-
255
-
256
-
257
-
258
 |
 |

THE ST. PAUL TRAVELERS COMPANIES, INC.AND SUBSIDIARIES
NOTES TO CONSOLIDATED FINANCIAL STATEMENTS (Continued)
156
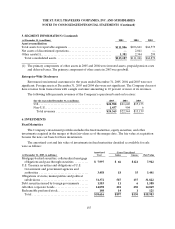
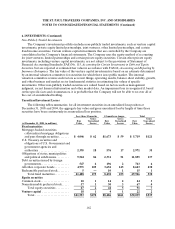
6. INVESTMENTS (Continued)
AmortizedGross Unrealized
(at December 31, 2004, in millions) Cost Gains Losses Fair Value
Mortgage-backed securities, collateralized mortgage obligations
and pass-through securities.............................. $8,543 $169 $ 34 $ 8,678
U.S. Treasury securities and obligations of U.S. Government
and government agencies and authorities.................. 3,015 40 22 3,033
Obligations of states, municipalities and political subdivisions.. 26,034 857 50 26,841
Debt securities issued by foreign governments ............... 1,846194 1,861
All other corporate bonds ................................. 13,383 36199 13,645
Redeemable preferredstock ............................... 196161 211
Total................................................. $ 53,017 $ 1,462$ 2 10 $ 54,269
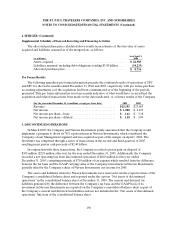
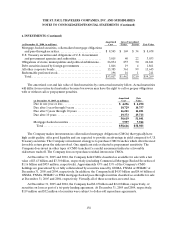
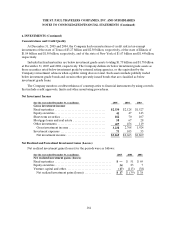
The amortized cost and fair value of fixed maturities by contractual maturity follow. Actual maturities
will differ from contractual maturities because borrowers may have the right to call or prepay obligations
with or without call or prepayment penalties.
(at December 31, 2005, in millions)
Amortized
Cost
Fair
Value
Due inone year or less................................... $ 4,296 $ 4,290
Due after 1 year through5 years ........................... 10,729 10,757
Due after 5 years through 10 years ......................... 16,221 16,281
Due after 10 years ....................................... 19,373 19,713
50,619 51,041
Mortgage-backed securities ............................... 7,997 7,942
Total................................................. $ 58,616 $ 58,983
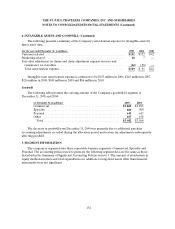
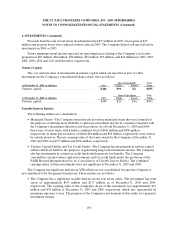
The Company makes investments in collateralized mortgage obligations (CMOs) that typically have
high credit quality, offer good liquidity and are expected to provide an advantage in yield compared to U.S.
Treasury securities. The Company’s investment strategy is to purchase CMO tranches which offer the most
favorable return given the risks involved. One significant risk evaluated is prepayment sensitivity. The
Company does invest in other types of CMO tranches if a careful assessment indicates a favorable
risk/return tradeoff. The Company does not purchase residual interests in CMOs.
At December 31, 2005 and 2004, the Company held CMOs classified as available for sale with a fair
value of $3.43 billion and $3.30 billion, respectively (excluding Commercial Mortgage-Backed Securities of
$1.16 billion and $953 million, respectively). Approximately 43% and 53% of the Company’s CMO
holdings are guaranteed by or fully collateralized by securities issued by GNMA, FNMA or FHLMC at
December 31, 2005 and 2004, respectively. In addition, the Company held $4.83 billion and $4.66 billion of
GNMA, FNMA, FHLMC or FHA mortgage-backed pass-through securities classified as available for sale
at December 31, 2005 and 2004, respectively. Virtually all of these securities are rated Aaa.
At December 31, 2005 and 2004, the Company had $2.67 billion and $2.60 billion, respectively, of
securities on loan as part of a tri-party lending agreement. At December 31, 2005 and 2004, respectively,
$119 million and $32 million of securities were subject to dollar-roll repurchase agreements.