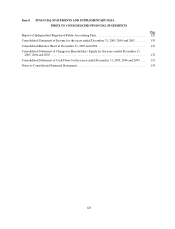
Travelers 2005 Annual Report Download - page 142
Download and view the complete annual report
Please find page 142 of the 2005 Travelers annual report below. You can navigate through the pages in the report by either clicking on the pages listed below, or by using the keyword search tool below to find specific information within the annual report.-
 1
1 -
2
-
3
-
4
-
5
-
6
-
7
-
8
-
9
-
10
-
11
-
12
-
13
-
14
-
15
-
16
-
17
-
18
-
19
-
20
-
21
-
22
-
23
-
24
-
25
-
26
-
27
-
28
-
29
-
30
-
31
-
32
-
33
-
34
-
35
-
36
-
37
-
38
-
39
-
40
-
41
-
42
-
43
-
44
-
45
-
46
-
47
-
48
-
49
-
50
-
51
-
52
-
53
-
54
-
55
-
56
-
57
-
58
-
59
-
60
-
61
-
62
-
63
-
64
-
65
-
66
-
67
-
68
-
69
-
70
-
71
-
72
-
73
-
74
-
75
-
76
-
77
-
78
-
79
-
80
-
81
-
82
-
83
-
84
-
85
-
86
-
87
-
88
-
89
-
90
-
91
-
92
-
93
-
94
-
95
-
96
-
97
-
98
-
99
-
100
-
101
-
102
-
103
-
104
-
105
-
106
-
107
-
108
-
109
-
110
-
111
-
112
-
113
-
114
-
115
-
116
-
117
-
118
-
119
-
120
-
121
-
122
-
123
-
124
-
125
-
126
-
127
-
128
-
129
-
130
-
131
-
 132
132 -
 133
133 -
 134
134 -
 135
135 -
 136
136 -
 137
137 -
 138
138 -
 139
139 -
 140
140 -
 141
141 -
 142
142 -
 143
143 -
 144
144 -
 145
145 -
 146
146 -
 147
147 -
 148
148 -
 149
149 -
 150
150 -
 151
151 -
 152
152 -
153
-
154
-
155
-
156
-
157
-
158
-
159
-
160
-
161
-
162
-
163
-
164
-
165
-
166
-
167
-
168
-
169
-
170
-
171
-
172
-
173
-
174
-
175
-
176
-
177
-
178
-
179
-
180
-
181
-
182
-
183
-
184
-
185
-
186
-
187
-
188
-
189
-
190
-
191
-
192
-
193
-
194
-
195
-
196
-
197
-
198
-
199
-
200
-
201
-
202
-
203
-
204
-
205
-
206
-
207
-
208
-
209
-
210
-
211
-
212
-
213
-
214
-
215
-
216
-
217
-
218
-
219
-
220
-
221
-
222
-
223
-
224
-
225
-
226
-
227
-
228
-
229
-
230
-
231
-
232
-
233
-
234
-
235
-
236
-
237
-
238
-
239
-
240
-
241
-
242
-
243
-
244
-
245
-
246
-
247
-
248
-
249
-
250
-
251
-
252
-
253
-
254
-
255
-
256
-
257
-
258
 |
 |

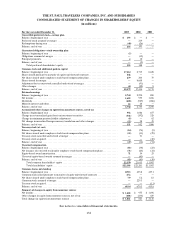
See notes to consolidated financial statements.
130
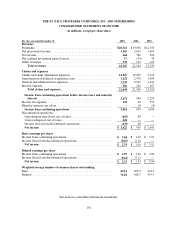
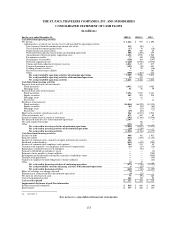
THE ST. PAUL TRAVELERS COMPANIES, INC.AND SUBSIDIARIES
CONSOLIDATED STATEMENT OF INCOME
(in millions, except per share data)
For the year ended December 31,2005 2004 2003
Revenues
Premiums ....................................................... $ 2 0,341 $ 1 9,038 $ 1 2,545
Net investment income. ........................................... 3,165 2,663 1,869
Fee income...................................................... 664 706 560
Net realized investment gains (losses)............................... 17
(39 ) 38
Other revenues .................................................. 178 176 127
Total revenues............................................... 24,365 22,544 15,139
Claims and expenses
Claims and claim adjustment expenses .............................. 14,927 15,439 9,118
Amortization of deferred acquisition costs. .......................... 3,252 2,978 1,984
General and administrative expenses ............................... 3,229 2,945 1,641
Interest expense. ................................................. 286 236 167
Total claims and expenses..................................... 21,694 21,598 12,910
Incomefrom continuing operations before income taxes and minority
interest ..................................................... 2,671 946 2,229
Income tax expense............................................... 610 69 537
Minority interest, net of tax........................................ —10 (4)
Incomefrom continuing operations .............................. 2,061 867 1,696
Discontinued operations:
Operating income (loss),net of taxes ............................. (663 )88 —
Gain on disposal, net of taxes .................................... 224 — —
Income (loss) from discontinued operations ....................... (439 )88 —
Net income.................................................... $1,622
$ 955 $1,696
Basic earnings per share
Income from continuingoperations. ................................ $3.04
$1.42 $3.91
Income (loss) from discontinued operations ......................... (0.65 )0.14 —
Net income.................................................... $2.39
$1.56 $3.91
Diluted earnings per share
Income from continuingoperations. ................................ $2.95
$1.40 $3.80
Income (loss) from discontinued operations ......................... (0.62 )0.13 —
Net income.................................................... $2.33
$1.53 $3.80
Weighted average number of common shares outstanding:
Basic ........................................................... 676.3 608.3 434.3
Diluted ......................................................... 712.8 628.3 453.3