Travelers 2005 Annual Report Download - page 78
Download and view the complete annual report
Please find page 78 of the 2005 Travelers annual report below. You can navigate through the pages in the report by either clicking on the pages listed below, or by using the keyword search tool below to find specific information within the annual report.-
 1
1 -
2
-
3
-
4
-
5
-
6
-
7
-
8
-
9
-
10
-
11
-
12
-
13
-
14
-
15
-
16
-
17
-
18
-
19
-
20
-
21
-
22
-
23
-
24
-
25
-
26
-
27
-
28
-
29
-
30
-
31
-
32
-
33
-
34
-
35
-
36
-
37
-
38
-
39
-
40
-
41
-
42
-
43
-
44
-
45
-
46
-
47
-
48
-
49
-
50
-
51
-
52
-
53
-
54
-
55
-
56
-
57
-
58
-
59
-
60
-
61
-
62
-
63
-
64
-
65
-
66
-
67
-
 68
68 -
 69
69 -
 70
70 -
 71
71 -
 72
72 -
 73
73 -
 74
74 -
 75
75 -
 76
76 -
 77
77 -
 78
78 -
 79
79 -
 80
80 -
 81
81 -
 82
82 -
 83
83 -
 84
84 -
 85
85 -
 86
86 -
 87
87 -
 88
88 -
89
-
90
-
91
-
92
-
93
-
94
-
95
-
96
-
97
-
98
-
99
-
100
-
101
-
102
-
103
-
104
-
105
-
106
-
107
-
108
-
109
-
110
-
111
-
112
-
113
-
114
-
115
-
116
-
117
-
118
-
119
-
120
-
121
-
122
-
123
-
124
-
125
-
126
-
127
-
128
-
129
-
130
-
131
-
132
-
133
-
134
-
135
-
136
-
137
-
138
-
139
-
140
-
141
-
142
-
143
-
144
-
145
-
146
-
147
-
148
-
149
-
150
-
151
-
152
-
153
-
154
-
155
-
156
-
157
-
158
-
159
-
160
-
161
-
162
-
163
-
164
-
165
-
166
-
167
-
168
-
169
-
170
-
171
-
172
-
173
-
174
-
175
-
176
-
177
-
178
-
179
-
180
-
181
-
182
-
183
-
184
-
185
-
186
-
187
-
188
-
189
-
190
-
191
-
192
-
193
-
194
-
195
-
196
-
197
-
198
-
199
-
200
-
201
-
202
-
203
-
204
-
205
-
206
-
207
-
208
-
209
-
210
-
211
-
212
-
213
-
214
-
215
-
216
-
217
-
218
-
219
-
220
-
221
-
222
-
223
-
224
-
225
-
226
-
227
-
228
-
229
-
230
-
231
-
232
-
233
-
234
-
235
-
236
-
237
-
238
-
239
-
240
-
241
-
242
-
243
-
244
-
245
-
246
-
247
-
248
-
249
-
250
-
251
-
252
-
253
-
254
-
255
-
256
-
257
-
258
 |
 |

66
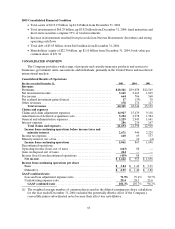
2005 ConsolidatedFinancial Condition
•Total assets of $113.19 billion, up $1.94 billion from December 31, 2004
•Total investments of $68.29 billion, up $3.92 billion from December 31, 2004; fixed maturities and
short-term securities comprise 93% of total investments
•Increase in investments resulted from proceeds from Nuveen Investments’ divestiture and strong
operating cash flows
•Total debt of $5.85 billion, down $463 million from December 31, 2004
•Shareholders’ equity of $22.30 billion, up $1.10 billion from December 31, 2004; book value per
common share of $31.94
CONSOLIDATED OVERVIEW
The Company provides a wide range of property and casualty insurance products and services to
businesses, government units, associations and individuals, primarily in the United States and in selected
international markets.
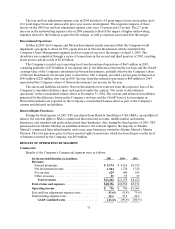
Consolidated Results of Operations
For the year ended December 31,2005 2004 2003
Revenues
Premiums ...................................................... $ 2 0,341 $ 1 9,038 $ 12,545
Net investment income. .......................................... 3,165 2,663 1,869
Fee income..................................................... 664 706 560
Net realized investment gains (losses).............................. 17 (39 ) 38
Other revenues ................................................. 178 176 127
Total revenues.............................................. 24,365 22,544 15,139
Claims and expenses
Claims and claim adjustment expenses ............................. 14,927 15,439 9,118
Amortization of deferred acquisition costs. ......................... 3,252 2,978 1,984
General and administrative expenses .............................. 3,229 2,945 1,641
Interest expense. ................................................ 286 236 167
Total claims and expenses.................................... 21,694 21,598 12,910
Incomefrom continuing operations before income taxes and
minority interest............................................ 2,671 946 2,229
Income tax expense.............................................. 610 69 537
Minority interest, net of tax....................................... — 10 (4)
Incomefrom continuing operations ............................. 2,061 867 1,696
Discontinued operations:
Operating income (loss),net of taxes .............................. (663 ) 88 —
Gain on disposal, net of taxes ..................................... 224 — —
Income (loss) from discontinued operations ........................ (439 ) 88 —
Net income................................................... $1,622 $ 955 $1,696
Income from continuing operations per share
Basic........................................................ $3.04 $1.42 $3.91
Diluted(1). ................................................... $2.95 $1.40 $3.80
GAAP combined ratio
Loss and lossadjustment expense ratio. .......................... 71.9 % 79.4 % 70.7%
Underwriting expense ratio. .................................... 29.4 28.3 25.6
GAAP combined ratio ....................................... 101.3 % 107.7 % 96.3%
(1) The weighted average number of common shares used in the diluted earnings per share calculation
for the year ended December 31, 2004 excluded the potentially dilutive effect of the Company’s
convertible junior subordinated notes because their effect was anti-dilutive.