Travelers 2005 Annual Report Download - page 166
Download and view the complete annual report
Please find page 166 of the 2005 Travelers annual report below. You can navigate through the pages in the report by either clicking on the pages listed below, or by using the keyword search tool below to find specific information within the annual report.-
 1
1 -
2
-
3
-
4
-
5
-
6
-
7
-
8
-
9
-
10
-
11
-
12
-
13
-
14
-
15
-
16
-
17
-
18
-
19
-
20
-
21
-
22
-
23
-
24
-
25
-
26
-
27
-
28
-
29
-
30
-
31
-
32
-
33
-
34
-
35
-
36
-
37
-
38
-
39
-
40
-
41
-
42
-
43
-
44
-
45
-
46
-
47
-
48
-
49
-
50
-
51
-
52
-
53
-
54
-
55
-
56
-
57
-
58
-
59
-
60
-
61
-
62
-
63
-
64
-
65
-
66
-
67
-
68
-
69
-
70
-
71
-
72
-
73
-
74
-
75
-
76
-
77
-
78
-
79
-
80
-
81
-
82
-
83
-
84
-
85
-
86
-
87
-
88
-
89
-
90
-
91
-
92
-
93
-
94
-
95
-
96
-
97
-
98
-
99
-
100
-
101
-
102
-
103
-
104
-
105
-
106
-
107
-
108
-
109
-
110
-
111
-
112
-
113
-
114
-
115
-
116
-
117
-
118
-
119
-
120
-
121
-
122
-
123
-
124
-
125
-
126
-
127
-
128
-
129
-
130
-
131
-
132
-
133
-
134
-
135
-
136
-
137
-
138
-
139
-
140
-
141
-
142
-
143
-
144
-
145
-
146
-
147
-
148
-
149
-
150
-
151
-
152
-
153
-
154
-
155
-
 156
156 -
 157
157 -
 158
158 -
 159
159 -
 160
160 -
 161
161 -
 162
162 -
 163
163 -
 164
164 -
 165
165 -
 166
166 -
 167
167 -
 168
168 -
 169
169 -
 170
170 -
 171
171 -
 172
172 -
 173
173 -
 174
174 -
 175
175 -
 176
176 -
177
-
178
-
179
-
180
-
181
-
182
-
183
-
184
-
185
-
186
-
187
-
188
-
189
-
190
-
191
-
192
-
193
-
194
-
195
-
196
-
197
-
198
-
199
-
200
-
201
-
202
-
203
-
204
-
205
-
206
-
207
-
208
-
209
-
210
-
211
-
212
-
213
-
214
-
215
-
216
-
217
-
218
-
219
-
220
-
221
-
222
-
223
-
224
-
225
-
226
-
227
-
228
-
229
-
230
-
231
-
232
-
233
-
234
-
235
-
236
-
237
-
238
-
239
-
240
-
241
-
242
-
243
-
244
-
245
-
246
-
247
-
248
-
249
-
250
-
251
-
252
-
253
-
254
-
255
-
256
-
257
-
258
 |
 |

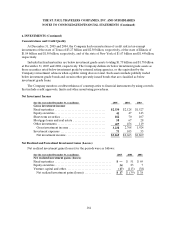
THE ST. PAUL TRAVELERS COMPANIES, INC.AND SUBSIDIARIES
NOTES TO CONSOLIDATED FINANCIAL STATEMENTS (Continued)
154
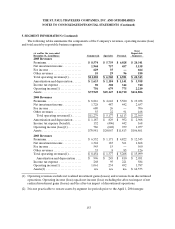
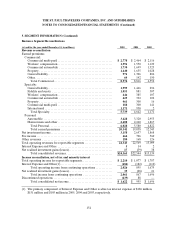
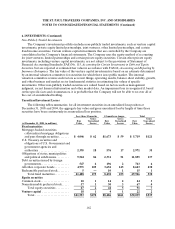
5. SEGMENT INFORMATION (Continued)
Business Segment Reconciliations
(at and for the year ended December 31, in millions) 2005 2004 2003
Revenue reconciliation
Earned premiums
Commercial:
Commercial multi-peril ....................................... $2,778 $2,464 $2,116
Workers’ compensation....................................... 1,591 1,550 1,129
Commercial automobile ...................................... 1,730 1,699 1,323
Property .................................................... 1,440 1,655 1,028
General liability. ............................................. 971 1,306 806
Other....................................................... 64 142 150
Total Commercial. ......................................... 8,574 8,816 6,552
Specialty:
General liability. ............................................. 1,995 1,446 296
Fidelity and surety ........................................... 1,053 881 507
Workers’ compensation....................................... 446 385 107
Commercial automobile ...................................... 425 392 102
Property .................................................... 461 308 16
Commercial multi-peril ....................................... 188 300 141
International ................................................ 1,171 930 2
Total Specialty............................................. 5,739 4,642 1,171
Personal:
Automobile................................................. 3,428 3,320 2,955
Homeowners and other....................................... 2,600 2,260 1,867
Total Personal ............................................. 6,028 5,580 4,822
Total earned premiums..................................... 20,341 19,038 12,545
Net investment income. ........................................... 3,158 2,657 1,868
Fee income...................................................... 664 706 560
Other revenues .................................................. 180 168 126
Total operating revenues for reportable segments .................... 24,343 22,569 15,099
Interest Expense and Other ....................................... 5 14 2
Net realized investment gains (losses)............................... 17 (39 ) 38
Total consolidated revenues................................. $ 2 4,365 $ 2 2,544 $ 1 5,139
Income reconciliation, net of tax and minority interest
Total operating income for reportable segments...................... $2,210 $1,077 $1,787
Interest Expense and Other(1) ..................................... (184 ) (182 ) (112)
Total operating income from continuingoperations............ 2,026 895 1,675
Net realized investment gains (losses)............................... 35 (28 ) 21
Total income from continuing operations ..................... 2,061 867 1,696
Discontinued operations.......................................... (439 ) 88 —
Total consolidated net income ............................... $1,622 $ 955 $1,696
(1) The primary component of Interest Expense and Other is after-tax interest expense of $186 million,
$151 million and $105 million in2005, 2004 and 2003, respectively.