Travelers 2005 Annual Report Download - page 169
Download and view the complete annual report
Please find page 169 of the 2005 Travelers annual report below. You can navigate through the pages in the report by either clicking on the pages listed below, or by using the keyword search tool below to find specific information within the annual report.-
 1
1 -
2
-
3
-
4
-
5
-
6
-
7
-
8
-
9
-
10
-
11
-
12
-
13
-
14
-
15
-
16
-
17
-
18
-
19
-
20
-
21
-
22
-
23
-
24
-
25
-
26
-
27
-
28
-
29
-
30
-
31
-
32
-
33
-
34
-
35
-
36
-
37
-
38
-
39
-
40
-
41
-
42
-
43
-
44
-
45
-
46
-
47
-
48
-
49
-
50
-
51
-
52
-
53
-
54
-
55
-
56
-
57
-
58
-
59
-
60
-
61
-
62
-
63
-
64
-
65
-
66
-
67
-
68
-
69
-
70
-
71
-
72
-
73
-
74
-
75
-
76
-
77
-
78
-
79
-
80
-
81
-
82
-
83
-
84
-
85
-
86
-
87
-
88
-
89
-
90
-
91
-
92
-
93
-
94
-
95
-
96
-
97
-
98
-
99
-
100
-
101
-
102
-
103
-
104
-
105
-
106
-
107
-
108
-
109
-
110
-
111
-
112
-
113
-
114
-
115
-
116
-
117
-
118
-
119
-
120
-
121
-
122
-
123
-
124
-
125
-
126
-
127
-
128
-
129
-
130
-
131
-
132
-
133
-
134
-
135
-
136
-
137
-
138
-
139
-
140
-
141
-
142
-
143
-
144
-
145
-
146
-
147
-
148
-
149
-
150
-
151
-
152
-
153
-
154
-
155
-
156
-
157
-
158
-
 159
159 -
 160
160 -
 161
161 -
 162
162 -
 163
163 -
 164
164 -
 165
165 -
 166
166 -
 167
167 -
 168
168 -
 169
169 -
 170
170 -
 171
171 -
 172
172 -
 173
173 -
 174
174 -
 175
175 -
 176
176 -
 177
177 -
 178
178 -
 179
179 -
180
-
181
-
182
-
183
-
184
-
185
-
186
-
187
-
188
-
189
-
190
-
191
-
192
-
193
-
194
-
195
-
196
-
197
-
198
-
199
-
200
-
201
-
202
-
203
-
204
-
205
-
206
-
207
-
208
-
209
-
210
-
211
-
212
-
213
-
214
-
215
-
216
-
217
-
218
-
219
-
220
-
221
-
222
-
223
-
224
-
225
-
226
-
227
-
228
-
229
-
230
-
231
-
232
-
233
-
234
-
235
-
236
-
237
-
238
-
239
-
240
-
241
-
242
-
243
-
244
-
245
-
246
-
247
-
248
-
249
-
250
-
251
-
252
-
253
-
254
-
255
-
256
-
257
-
258
 |
 |

THE ST. PAUL TRAVELERS COMPANIES, INC.AND SUBSIDIARIES
NOTES TO CONSOLIDATED FINANCIAL STATEMENTS (Continued)
157
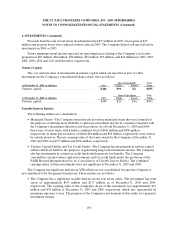
6. INVESTMENTS (Continued)
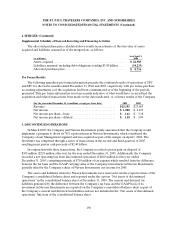
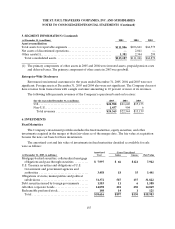
Proceeds from sales of fixed maturities classified as available for sale were $5.19 billion, $7.95 billion
and $8.34 billion in 2005, 2004 and 2003, respectively. Gross gains of $129 million, $202 million and $282
million and gross losses of $118 million, $126 million and $147 million were realized on those sales in 2005,
2004 and 2003, respectively.
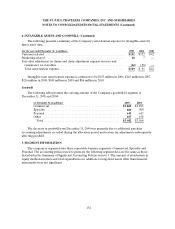
At December 31, 2005 and 2004, the Company’s insurance subsidiaries had $4.00 billion and $3.39
billion, respectively, of securities on deposit at financial institutions in certain states pursuant to the
respective states’ insurance regulatory authorities.
The Company’s subsidiaries, Unionamerica and St. Paul Re-U.K.,and the Company’s operations at
Lloyd’s are required, as accredited U.S. reinsurers, to hold certain investments in trust in the United
States. These trust funds had a fair value of $374 million and $359 million at December 31, 2005 and 2004,
respectively. Additionally, Unionamerica, St. Paul Re-U.K. and Discover Re have funds deposited with
third parties to be used as collateral to secure various liabilities on behalf of insureds, cedants and other
creditors. These funds had a fair value of $43 million and $55 million at December 31, 2005 and 2004,
respectively. The Company also had $85 million of other investments being used to secure obligations
under a series of insurance transactions, and $312 million of other investments pledged as collateral
securing outstanding letters of credit.
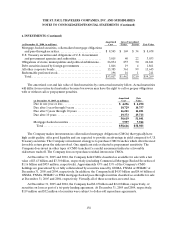
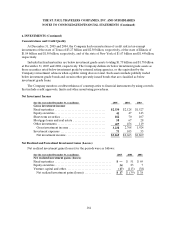
Equity Securities
The cost and fair value of investments in equity securities were asfollows:
Gross Unrealized Fair
(at December 31, 2005, in millions) Cost Gains Losses Value
Common stock. .................................... $ 136 $ 24 $ 3$ 1 57
Non-redeemable preferred stock..................... 402 24 4 422
Total........................................... $ 538 $ 48 $ 7$ 5 79
Gross Unrealized Fair
(at December 31, 2004, in millions) Cost Gains Losses Value
Commonstock..................................... $148 $ 31 $ 2$ 1 77
Non-redeemable preferred stock..................... 539463582
Total........................................... $687 $ 77 $ 5$ 7 59
Proceeds from sales of equity securities were $403 million, $265 million and $254 million in 2005, 2004
and 2003, respectively, resulting in gross realized gains of $43 million, $37 million and $22 million and
gross realized losses of $9 million, $8 million and $9 million, respectively.
Real Estate
The Company’s real estate investments include warehouses, office buildings, land, and other
commercial real estate assets that are directly owned. The Company negotiates commercial leases with
individual tenants through unrelated, licensed real estate brokers. Negotiated terms and conditions
include, among others, rental rates, length of lease period and improvements to the premises to be
provided by the landlord.