IBM 2015 Annual Report Download - page 82
Download and view the complete annual report
Please find page 82 of the 2015 IBM annual report below. You can navigate through the pages in the report by either clicking on the pages listed below, or by using the keyword search tool below to find specific information within the annual report.-
 1
1 -
2
-
3
-
4
-
5
-
6
-
7
-
8
-
9
-
10
-
11
-
12
-
13
-
14
-
15
-
16
-
17
-
18
-
19
-
20
-
21
-
22
-
23
-
24
-
25
-
26
-
27
-
28
-
29
-
30
-
31
-
32
-
33
-
34
-
35
-
36
-
37
-
38
-
39
-
40
-
41
-
42
-
43
-
44
-
45
-
46
-
47
-
48
-
49
-
50
-
51
-
52
-
53
-
54
-
55
-
56
-
57
-
58
-
59
-
60
-
61
-
62
-
63
-
64
-
65
-
66
-
67
-
68
-
69
-
70
-
71
-
 72
72 -
 73
73 -
 74
74 -
 75
75 -
 76
76 -
 77
77 -
 78
78 -
 79
79 -
 80
80 -
 81
81 -
 82
82 -
 83
83 -
 84
84 -
 85
85 -
 86
86 -
 87
87 -
 88
88 -
 89
89 -
 90
90 -
 91
91 -
 92
92 -
93
-
94
-
95
-
96
-
97
-
98
-
99
-
100
-
101
-
102
-
103
-
104
-
105
-
106
-
107
-
108
-
109
-
110
-
111
-
112
-
113
-
114
-
115
-
116
-
117
-
118
-
119
-
120
-
121
-
122
-
123
-
124
-
125
-
126
-
127
-
128
-
129
-
130
-
131
-
132
-
133
-
134
-
135
-
136
-
137
-
138
-
139
-
140
-
141
-
142
-
143
-
144
-
145
-
146
-
147
-
148
-
149
-
150
-
151
-
152
-
153
-
154
-
155
-
156
 |
 |

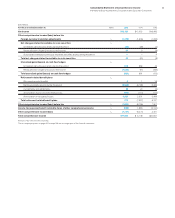
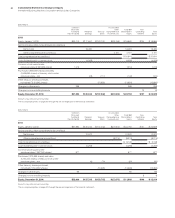
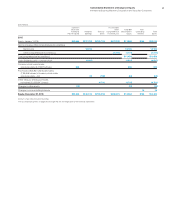
80 Consolidated Statement of Changes in Equity
International Business Machines Corporation and Subsidiary Companies
($ inmillions)
Common
Stock and
Additional
Paid-In Capital
Retained
Earnings
Treasury
Stock
Accumulated
Other
Comprehensive
Income/(Loss)
Total IBM
Stockholders
Equity
’
Non-
Controlling
Interests
Total
Equity
2013
Equity, January 1, 2013 $50,110 $117,641 $(123,131) $(25,759) $ 18,860 $124 $ 18,984
Net income plus other comprehensive income/(loss)
Net income 16,483 16,483 16,483
Other comprehensive income/(loss) 4,157 4,157 4,157
Total comprehensive income/(loss) $ 20,641 $ 20,641
Cash dividends paid—common stock (4,058) (4,058) (4,058)
Common stock issued under
employee plans (9,961,389 shares) 1,216 1,216 1,216
Purchases (1,666,069 shares) and sales
(1,849,883 shares) of treasury stock under
employee plans—net (25) (117) (142) (142)
Other treasury shares purchased,
not retired (73,121,942 shares) (13,993) (13,993) (13,993)
Changes in other equity 268 268 268
Changes in noncontrolling interests 13 13
Equity, December 31, 2013 $51,594 $130,042 $(137,242) $(21,602) $ 22,792 $137 $ 22,929
Amounts may not add due to rounding.
The accompanying notes on pages 82 through 146 are an integral part of the financial statements.
($ inmillions)
Common
Stock and
Additional
Paid-In Capital
Retained
Earnings
Treasury
Stock
Accumulated
Other
Comprehensive
Income/(Loss)
Total IBM
Stockholders
Equity
’
Non-
Controlling
Interests
Total
Equity
2014
Equity, January 1, 2014 $51,594 $130,042 $(137,242) $(21,602) $ 22,792 $137 $ 22,929
Net income plus other comprehensive income/(loss)
Net income 12,022 12,022 12,022
Other comprehensive income/(loss) (6,274) (6,274) (6,274)
Total comprehensive income/(loss) $ 5,748 $ 5,748
Cash dividends paid—common stock (4,265) (4,265) (4,265)
Common stock issued under
employee plans (7,687,026 shares) 977 977 977
Purchases (1,313,569 shares) and sales
(1,264,232 shares) of treasury stock under
employee plans—net (6) (79) (85) (85)
Other treasury shares purchased,
not retired (71,504,867 shares) (13,395) (13,395) (13,395)
Changes in other equity 95 95 95
Changes in noncontrolling interests 88
Equity, December 31, 2014 $52,666 $137,793 $(150,715) $(27,875) $ 11,868 $146 $ 12,014
Amounts may not add due to rounding.
The accompanying notes on pages 82 through 146 are an integral part of the financial statements.