IBM 2015 Annual Report Download - page 145
Download and view the complete annual report
Please find page 145 of the 2015 IBM annual report below. You can navigate through the pages in the report by either clicking on the pages listed below, or by using the keyword search tool below to find specific information within the annual report.-
 1
1 -
2
-
3
-
4
-
5
-
6
-
7
-
8
-
9
-
10
-
11
-
12
-
13
-
14
-
15
-
16
-
17
-
18
-
19
-
20
-
21
-
22
-
23
-
24
-
25
-
26
-
27
-
28
-
29
-
30
-
31
-
32
-
33
-
34
-
35
-
36
-
37
-
38
-
39
-
40
-
41
-
42
-
43
-
44
-
45
-
46
-
47
-
48
-
49
-
50
-
51
-
52
-
53
-
54
-
55
-
56
-
57
-
58
-
59
-
60
-
61
-
62
-
63
-
64
-
65
-
66
-
67
-
68
-
69
-
70
-
71
-
72
-
73
-
74
-
75
-
76
-
77
-
78
-
79
-
80
-
81
-
82
-
83
-
84
-
85
-
86
-
87
-
88
-
89
-
90
-
91
-
92
-
93
-
94
-
95
-
96
-
97
-
98
-
99
-
100
-
101
-
102
-
103
-
104
-
105
-
106
-
107
-
108
-
109
-
110
-
111
-
112
-
113
-
114
-
115
-
116
-
117
-
118
-
119
-
120
-
121
-
122
-
123
-
124
-
125
-
126
-
127
-
128
-
129
-
130
-
131
-
132
-
133
-
134
-
 135
135 -
 136
136 -
 137
137 -
 138
138 -
 139
139 -
 140
140 -
 141
141 -
 142
142 -
 143
143 -
 144
144 -
 145
145 -
 146
146 -
 147
147 -
 148
148 -
 149
149 -
 150
150 -
 151
151 -
 152
152 -
 153
153 -
 154
154 -
 155
155 -
156
 |
 |

Notes to Consolidated Financial Statements
International Business Machines Corporation and Subsidiary Companies
143
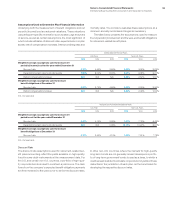
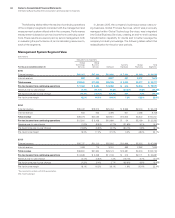
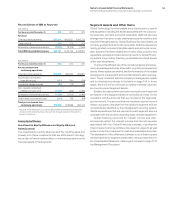
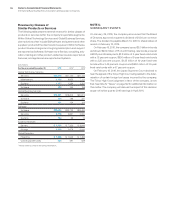
Reconciliations of IBM as Reported
($ inmillions)
For the year ended December 31: 2015 2014 2013
Revenue
Total reportable segments $89,211 $100,527 $105,732
Other revenue 206 374 478
Elimination of internal transactions (7,676) (8,108) (7,843)
Total IBM consolidated revenue $81,741 $ 92,793 $ 98,367
($ inmillions)
For the year ended December 31: 2015 2014 2013
Pre-tax income from
continuing operations:
Total reportable segments $19,670 $22,262 $23,687
Amortization of acquired
intangible assets (677) (791) (758)
Acquisition-related charges (26) (12) (46)
Non-operating retirement-
related (costs)/income (1,050) (353) (1,062)
Elimination of internal transactions (1,859) (1,914) (1,480)
Unallocated corporate amounts* (114) 795 (98)
Total pre-tax income from
continuing operations $15,945 $19,986 $20,244
* The 2014 and 2013 amounts include the gain related to the Retail Store Solutions
divestiture. The 2014 amount also includes the net gain related to the System x
business divestiture.
Immaterial Items
Investment in Equity Alliances and Equity Alliances
Gains/(Losses)
The investments in equity alliances and the resulting gains and
(losses) from these investments that are attributable to the seg-
ments did not have a material effect on the financial position or the
financial results of the segments.
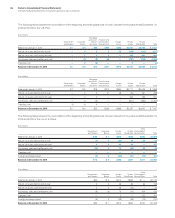
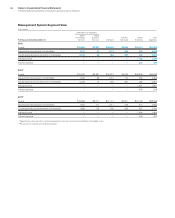
Segment Assets and Other Items
Global Technology Services assets are primarily plant, property
and equipment, including the assets associated with the outsourc-
ing business, goodwill, accounts receivable, deferred services
arrangement transition costs, maintenance parts inventory and
acquired intangible assets. Global Business Services assets are
primarily goodwill and accounts receivable. Software assets are
mainly goodwill, acquired intangible assets and accounts receiv-
able. Systems Hardware assets are primarily plant, property and
equipment, goodwill and manufacturing inventory. Global Financ-
ing assets are primarily financing receivables and fixed assets
under operating leases.
To ensure the efficient use of the company’s space and equip-
ment, several segments may share plant, property and equipment
assets. Where assets are shared, landlord ownership of the assets
is assigned to one segment and is not allocated to each user seg-
ment. This is consistent with the company’s management system
and is reflected accordingly in the table on page144. In those
cases, there will not be a precise correlation between segment
pre-tax income and segment assets.
Similarly, the depreciation amounts reported by each segment
are based on the assigned landlord ownership and may not be
consistent with the amounts that are included in the segments’
pre-tax income. The amounts that are included in pre-tax income
reflect occupancy charges from the landlord segment and are
not specifically identified by the management reporting system.
Capital expenditures that are reported by each segment also are
consistent with the landlord ownership basis of asset assignment.
Global Financing amounts for interest income and inter-
est expense reflect the interest income and interest expense
associated with the Global Financing business, including the
intercompany financing activities discussed on page27, as well
as the income from investment in cash and marketable securities.
The explanation of the difference between cost of financing and
interest expense for segment presentation versus presentation in
the Consolidated Statement of Earnings is included on page72 of
the Management Discussion.