IBM 2015 Annual Report Download - page 81
Download and view the complete annual report
Please find page 81 of the 2015 IBM annual report below. You can navigate through the pages in the report by either clicking on the pages listed below, or by using the keyword search tool below to find specific information within the annual report.-
 1
1 -
2
-
3
-
4
-
5
-
6
-
7
-
8
-
9
-
10
-
11
-
12
-
13
-
14
-
15
-
16
-
17
-
18
-
19
-
20
-
21
-
22
-
23
-
24
-
25
-
26
-
27
-
28
-
29
-
30
-
31
-
32
-
33
-
34
-
35
-
36
-
37
-
38
-
39
-
40
-
41
-
42
-
43
-
44
-
45
-
46
-
47
-
48
-
49
-
50
-
51
-
52
-
53
-
54
-
55
-
56
-
57
-
58
-
59
-
60
-
61
-
62
-
63
-
64
-
65
-
66
-
67
-
68
-
69
-
70
-
 71
71 -
 72
72 -
 73
73 -
 74
74 -
 75
75 -
 76
76 -
 77
77 -
 78
78 -
 79
79 -
 80
80 -
 81
81 -
 82
82 -
 83
83 -
 84
84 -
 85
85 -
 86
86 -
 87
87 -
 88
88 -
 89
89 -
 90
90 -
 91
91 -
92
-
93
-
94
-
95
-
96
-
97
-
98
-
99
-
100
-
101
-
102
-
103
-
104
-
105
-
106
-
107
-
108
-
109
-
110
-
111
-
112
-
113
-
114
-
115
-
116
-
117
-
118
-
119
-
120
-
121
-
122
-
123
-
124
-
125
-
126
-
127
-
128
-
129
-
130
-
131
-
132
-
133
-
134
-
135
-
136
-
137
-
138
-
139
-
140
-
141
-
142
-
143
-
144
-
145
-
146
-
147
-
148
-
149
-
150
-
151
-
152
-
153
-
154
-
155
-
156
 |
 |

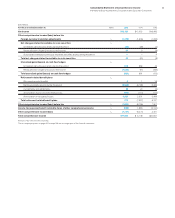
79
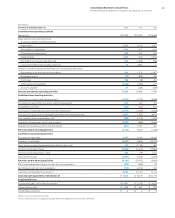
Consolidated Statement of Cash Flows
International Business Machines Corporation and Subsidiary Companies
($ inmillions)
For the year ended December 31: 2015 2014 2013
Cash fl ows from operating activities
Net income $13,190 $ 12,022 $ 16,483
Adjustments to reconcile net income
to cash provided by operating activities
Depreciation 2,662 3,145 3,327
Amortization of intangibles 1,193 1,347 1,351
Stock-based compensation 468 512 614
Deferred taxes 1,387 (237) (1,610)
Net (gain)/loss on asset sales and other 481 (1,535) (236)
Loss on microelectronics business disposal 71 3,381 —
Change in operating assets and liabilities, net of acquisitions/divestitures
Receivables (including fi nancing receivables) 812 1,270 (1,407)
Retirement related (22) (655) 294
Inventories 133 (39) (57)
Other assets/other liabilities (3,448) (1,886) (747)
Accounts payable 81 (456) (529)
Net cash provided by operating activities 17,008 16,868 17,485
Cash fl ows from investing activities
Payments for property, plant and equipment (3,579) (3,740) (3,623)
Proceeds from disposition of property, plant and equipment 370 404 372
Investment in software (572) (443) (517)
Purchases of marketable securities and other investments (3,073) (2,338) (4,608)
Proceeds from disposition of marketable securities and other investments 2,842 2,493 4,873
Non-operating fi nance receivables—net (398) (1,078) (1,063)
Acquisition of businesses, net of cash acquired (3,349) (656) (3,056)
Divestiture of businesses, net of cash transferred (401) 2,357 297
Net cash used in investing activities (8,159) (3,001) (7,326)
Cash fl ows from fi nancing activities
Proceeds from new debt 5,540 8,180 16,353
Payments to settle debt (5,622) (4,644) (10,013)
Short-term borrowings/(repayments) less than 90 days—net 101 (1,753) 621
Common stock repurchases (4,609) (13,679) (13,859)
Common stock transactions—other 322 709 1,074
Cash dividends paid (4,897) (4,265) (4,058)
Net cash used in fi nancing activities (9,166) (15,452) (9,883)
Effect of exchange rate changes on cash and cash equivalents (473) (655) 28
Net change in cash and cash equivalents (790) (2,240) 304
Cash and cash equivalents at January 1 8,476 10,716 10,412
Cash and cash equivalents at December 31 $ 7,686 $ 8,476 $ 10,716
Supplemental data
Income taxes paid—net of refunds received $ 2,657 $ 5,748 $ 4,024
Interest paid on debt $ 995 $ 1,061 $ 982
Capital lease obligations $ 4 $ 2 $ 14
Amounts may not add due to rounding.
The accompanying notes on pages 82 through 146 are an integral part of the financial statements.