IBM 2015 Annual Report Download - page 44
Download and view the complete annual report
Please find page 44 of the 2015 IBM annual report below. You can navigate through the pages in the report by either clicking on the pages listed below, or by using the keyword search tool below to find specific information within the annual report.-
 1
1 -
2
-
3
-
4
-
5
-
6
-
7
-
8
-
9
-
10
-
11
-
12
-
13
-
14
-
15
-
16
-
17
-
18
-
19
-
20
-
21
-
22
-
23
-
24
-
25
-
26
-
27
-
28
-
29
-
30
-
31
-
32
-
33
-
 34
34 -
 35
35 -
 36
36 -
 37
37 -
 38
38 -
 39
39 -
 40
40 -
 41
41 -
 42
42 -
 43
43 -
 44
44 -
 45
45 -
 46
46 -
 47
47 -
 48
48 -
 49
49 -
 50
50 -
 51
51 -
 52
52 -
 53
53 -
 54
54 -
55
-
56
-
57
-
58
-
59
-
60
-
61
-
62
-
63
-
64
-
65
-
66
-
67
-
68
-
69
-
70
-
71
-
72
-
73
-
74
-
75
-
76
-
77
-
78
-
79
-
80
-
81
-
82
-
83
-
84
-
85
-
86
-
87
-
88
-
89
-
90
-
91
-
92
-
93
-
94
-
95
-
96
-
97
-
98
-
99
-
100
-
101
-
102
-
103
-
104
-
105
-
106
-
107
-
108
-
109
-
110
-
111
-
112
-
113
-
114
-
115
-
116
-
117
-
118
-
119
-
120
-
121
-
122
-
123
-
124
-
125
-
126
-
127
-
128
-
129
-
130
-
131
-
132
-
133
-
134
-
135
-
136
-
137
-
138
-
139
-
140
-
141
-
142
-
143
-
144
-
145
-
146
-
147
-
148
-
149
-
150
-
151
-
152
-
153
-
154
-
155
-
156
 |
 |

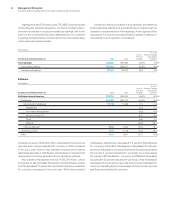
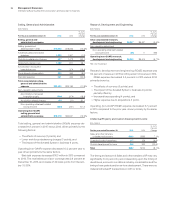
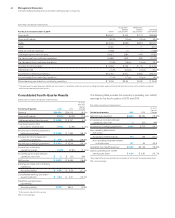
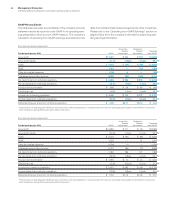
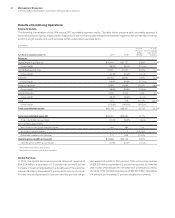
42 Management Discussion
International Business Machines Corporation and Subsidiary Companies
($ inmillions except per share amount)
For the year ended December 31, 2014: GAAP
Acquisition-
Related
Adjustments
Retirement-
Related
Adjustments
Operating
(non-GAAP)
Gross profi t $46,407 $ 416 $ 173 $46,996
Gross profi t margin 50.0% 0.4 pts. 0.2 pts. 50.6%
SG&A $23,180 $(385) $(257 ) $22,537
RD&E 5,437 — 77 5,514
Other (income) and expense (1,938) (1) — (1,939)
Total expense and other (income) 26,421 (386) (180) 25,855
Pre-tax income from continuing operations 19,986 803 353 21,142
Pre-tax margin from continuing operations 21.5% 0.9 pts. 0.4 pts. 22.8%
Provision for income taxes* $ 4,234 $ 133 $ 73 $ 4,440
Effective tax rate 21.2% (0.2) pts. 0.0 pts. 21.0%
Income from continuing operations $15,751 $ 670 $ 280 $16,702
Income margin from continuing operations 17.0% 0.7 pts. 0.3 pts. 18.0%
Diluted earnings per share from continuing operations $ 15.59 $0.66 $0.28 $ 16.53
* The tax impact on operating (non-GAAP) pre-tax income is calculated under the same accounting principles applied to the GAAP pre-tax income which employs an annual
effective tax rate method to the results.
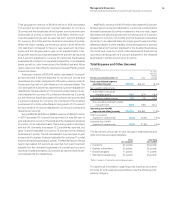
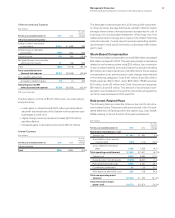
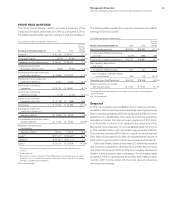
Consolidated Fourth-Quarter Results
($ and shares inmillions except per share amounts)
For the fourth quarter: 2015 2014
Yr.-to-Yr.
Percent/
Margin
Change
Revenue $22,059 $24,113 (8.5)%*
Gross profi t margin 51.7% 53.3% (1.6) pts.
Total expense and other (income) $ 6,308 $ 5,767 9.4%
Total expense and other
(income)-to-revenue ratio 28.6% 23.9% 4.7 pts.
Income from continuing operations
before income taxes $ 5,098 $ 7,094 (28.1)%
Provision for income taxes from
continuing operations $ 638 $ 1,580 (59.6)%
Income from continuing operations $ 4,460 $ 5,515 (19.1)%
Income from continuing
operations margin 20.2% 22.9% (2.7) pts.
Income/(loss) from discontinued
operations, net of tax $ 3 $ (31) NM
Net income $ 4,463 $ 5,484 (18.6)%
Earnings per share from continuing
operations:
Assuming dilution $ 4.59 $ 5.54 (17.1)%
Consolidated earnings per share—
assuming dilution $ 4.59 $ 5.51 (16.7)%
Weighted-average shares
outstanding
Assuming dilution 972.8 995.4 (2.3)%
* (2.3)percent adjusted for currency.
NM—Not meaningful
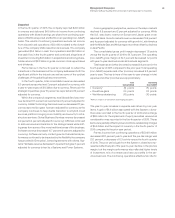
The following table provides the company’s operating (non-GAAP)
earnings for the fourth quarter of 2015 and 2014.
($ inmillions except per share amounts)
For the fourth quarter: 2015 2014
Yr.-to-Yr.
Percent
Change
Net income as reported $4,463 $5,484 (18.6)%
Income/(loss) from discontinued
operations, net of tax 3(31) NM
Income from continuing operations 4,460 5,515 (19.1)
Non-operating adjustments
(net of tax)
Acquisition-related charges 110 186 (41.0)
Non-operating retirement-related
costs/(income) 137 84 63.8
Operating (non-GAAP) earnings* $4,707 $5,785 (18.6)%
Diluted operating (non-GAAP)
earnings per share $ 4.84 $ 5.81 (16.7)%
* See page48 for a more detailed reconciliation of net income to operating earnings.
NM—Not meaningful