IBM 2015 Annual Report Download - page 53
Download and view the complete annual report
Please find page 53 of the 2015 IBM annual report below. You can navigate through the pages in the report by either clicking on the pages listed below, or by using the keyword search tool below to find specific information within the annual report.-
 1
1 -
2
-
3
-
4
-
5
-
6
-
7
-
8
-
9
-
10
-
11
-
12
-
13
-
14
-
15
-
16
-
17
-
18
-
19
-
20
-
21
-
22
-
23
-
24
-
25
-
26
-
27
-
28
-
29
-
30
-
31
-
32
-
33
-
34
-
35
-
36
-
37
-
38
-
39
-
40
-
41
-
42
-
 43
43 -
 44
44 -
 45
45 -
 46
46 -
 47
47 -
 48
48 -
 49
49 -
 50
50 -
 51
51 -
 52
52 -
 53
53 -
 54
54 -
 55
55 -
 56
56 -
 57
57 -
 58
58 -
 59
59 -
 60
60 -
 61
61 -
 62
62 -
 63
63 -
64
-
65
-
66
-
67
-
68
-
69
-
70
-
71
-
72
-
73
-
74
-
75
-
76
-
77
-
78
-
79
-
80
-
81
-
82
-
83
-
84
-
85
-
86
-
87
-
88
-
89
-
90
-
91
-
92
-
93
-
94
-
95
-
96
-
97
-
98
-
99
-
100
-
101
-
102
-
103
-
104
-
105
-
106
-
107
-
108
-
109
-
110
-
111
-
112
-
113
-
114
-
115
-
116
-
117
-
118
-
119
-
120
-
121
-
122
-
123
-
124
-
125
-
126
-
127
-
128
-
129
-
130
-
131
-
132
-
133
-
134
-
135
-
136
-
137
-
138
-
139
-
140
-
141
-
142
-
143
-
144
-
145
-
146
-
147
-
148
-
149
-
150
-
151
-
152
-
153
-
154
-
155
-
156
 |
 |

51
Management Discussion
International Business Machines Corporation and Subsidiary Companies
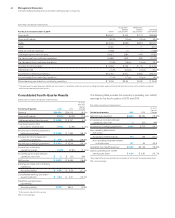
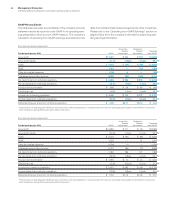
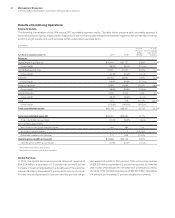
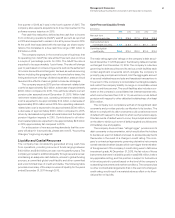
Total expense and other (income) decreased 7.1percent in
2014 versus 2013. Total operating (non-GAAP) expense and other
(income) decreased 6.3percent year to year. The year-to-year
drivers were approximately:
Total Operating
Consolidated (non-GAAP)
• Currency* (1) point (1) point
• Acquisitions** 2 points 2 points
• Base expense (8) points (7) points
* Reflects impacts of translation and hedging programs.
** Includes acquisitions completed in prior 12-month period; operating (non-GAAP) is
net of non-operating acquisition-related charges.
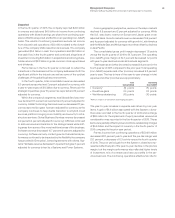
The reported base expense reflected not only the ongoing run
rate of the business, but also the impact of divestitures and work-
force rebalancing charges. The company recorded pre-tax gains
of $1.6billion in 2014 related to the divestitures of the Systemx
($1.4billion) and customer care ($0.2billion) businesses. Work-
force rebalancing charges in 2014 were $1.5billion, an increase
of $0.4billion year to year. Excluding the gains from the divested
businesses and the impact of workforce rebalancing charges,
operating (non-GAAP) base expense decreased 3points year
to year versus the 7point as-reported decrease. Within base
expense, the company continued to shift resources and spending
to areas within the strategic imperatives.
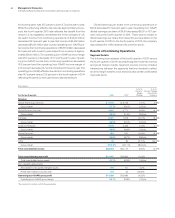
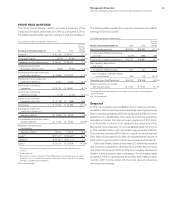
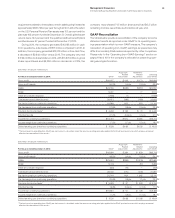
Pre-tax income from continuing operations decreased 1.3per-
cent and the pre-tax margin was 21.5percent, an increase of
1.0points versus 2013. The continuing operations effective tax
rate for 2014 was 21.2percent, an increase of 4.6points versus
the prior year primarily driven by benefits in the 2013 rate asso-
ciated with discrete items. Income from continuing operations of
$15.8billion decreased 6.7percent and the net income margin
was 17.0percent, a decrease of 0.2points versus 2013. Losses
from discontinued operations, net of tax, were $3.7billion in
2014 compared to $0.4billion 2013. Net income of $12.0billion
decreased $4.5billion year to year. Operating (non-GAAP) pre-
tax income from continuing operations decreased 4.4percent
year to year and the operating (non-GAAP) pre-tax margin from
continuing operations improved 0.3points to 22.8percent versus
2013. Operating (non-GAAP) income from continuing operations of
$16.7billion decreased 9.0percent and the operating (non-GAAP)
income margin from continuing operations of 18.0percent
decreased 0.7points. The operating (non-GAAP) effective tax
rate from continuing operations in 2014 was 21.0percent versus
17.0percent in 2013.
Diluted earnings per share from continuing operations of
$15.59 increased 1.9percent year to year reflecting the benefits
of the common stock repurchase program. In 2014, the company
repurchased 71.5million shares of its common stock. Operat-
ing (non-GAAP) diluted earnings per share of $16.53 decreased
0.7percent versus 2013 driven primarily by the impacts of
decreased revenue and the higher tax rate, partially offset by the
impact of share repurchases. Diluted earnings per share from
discontinued operations was ($3.69) in 2014 compared to ($0.36)
in 2013.
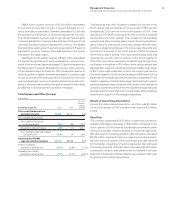
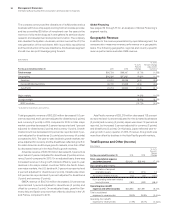
At December31, 2014, the company continued to have the
financial flexibility to support the business over the long term. Cash
and marketable securities at year end was $8.5billion, a decrease
of $2.6billion from December31, 2013. Key drivers in the balance
sheet and total cash flows are highlighted below:
Total assets decreased $8.4billion ($2.3billion adjusted for
currency) from December31, 2013 driven by:
• Decreases in prepaid pension assets ($3.4billion), property,
plant and equipment ($3.1billion) driven primarily by the
expected divestiture of the Microelectronics business ($2.4
billion), cash and cash equivalents ($2.2billion) and total
receivables ($1.7billion); partially offset by
• Increased deferred taxes ($2.5billion).
Total liabilities increased $2.5billion ($7.3billion adjusted for cur-
rency) from December31, 2013 driven by:
• Increases in pension liabilities ($2.0billion) and total debt
($1.1billion).
Total equity of $12.0billion decreased $10.9billion from Decem-
ber31, 2013 as a result of:
• Increased treasury stock ($13.5billion) primarily from share
repurchases, and increased losses in accumulated other
comprehensive income/(loss) ($6.3billion), driven primarily
by the year-end remeasurement of the retirement-related
liabilities; partially offset by
• Higher retained earnings ($7.8billion) and higher common
stock ($1.1billion).
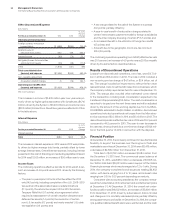
The company generated $16.9billion in cash flow provided by
operating activities, a decrease of $0.6billion when compared
to 2013, driven primarily by a higher level of cash tax payments
($1.7billion). Net cash used in investing activities of $3.0billion was
$4.3billion lower than 2013, primarily due to a decrease in cash
used for acquisitions ($2.4billion) and an increase in cash provided
from divestitures ($2.1billion). Net cash used in financing activities
of $15.5billion increased $5.6billion compared to 2013, driven
primarily by lower net cash proceeds from total debt ($5.2billion).