IBM 2015 Annual Report Download - page 59
Download and view the complete annual report
Please find page 59 of the 2015 IBM annual report below. You can navigate through the pages in the report by either clicking on the pages listed below, or by using the keyword search tool below to find specific information within the annual report.-
 1
1 -
2
-
3
-
4
-
5
-
6
-
7
-
8
-
9
-
10
-
11
-
12
-
13
-
14
-
15
-
16
-
17
-
18
-
19
-
20
-
21
-
22
-
23
-
24
-
25
-
26
-
27
-
28
-
29
-
30
-
31
-
32
-
33
-
34
-
35
-
36
-
37
-
38
-
39
-
40
-
41
-
42
-
43
-
44
-
45
-
46
-
47
-
48
-
 49
49 -
 50
50 -
 51
51 -
 52
52 -
 53
53 -
 54
54 -
 55
55 -
 56
56 -
 57
57 -
 58
58 -
 59
59 -
 60
60 -
 61
61 -
 62
62 -
 63
63 -
 64
64 -
 65
65 -
 66
66 -
 67
67 -
 68
68 -
 69
69 -
70
-
71
-
72
-
73
-
74
-
75
-
76
-
77
-
78
-
79
-
80
-
81
-
82
-
83
-
84
-
85
-
86
-
87
-
88
-
89
-
90
-
91
-
92
-
93
-
94
-
95
-
96
-
97
-
98
-
99
-
100
-
101
-
102
-
103
-
104
-
105
-
106
-
107
-
108
-
109
-
110
-
111
-
112
-
113
-
114
-
115
-
116
-
117
-
118
-
119
-
120
-
121
-
122
-
123
-
124
-
125
-
126
-
127
-
128
-
129
-
130
-
131
-
132
-
133
-
134
-
135
-
136
-
137
-
138
-
139
-
140
-
141
-
142
-
143
-
144
-
145
-
146
-
147
-
148
-
149
-
150
-
151
-
152
-
153
-
154
-
155
-
156
 |
 |

57
Management Discussion
International Business Machines Corporation and Subsidiary Companies
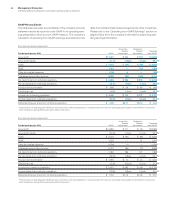
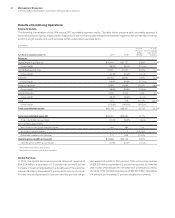
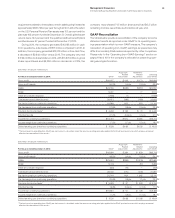
Selling, General and Administrative
($ inmillions)
For the year ended December 31: 2014 2013
Yr.-to-Yr.
Percent
Change
Selling, general and
administrative expense
Selling, general and
administrative—other $18,532 $19,178 (3.4)%
Advertising and promotional
expense 1,307 1,294 1.1
Workforce rebalancing charges 1,472 1,031 42.7
Retirement-related costs 811 986 (17.8)
Amortization of acquired
intangible assets 374 370 1.2
Stock-based compensation 350 435 (19.4)
Bad debt expense 334 156 113.8
Total consolidated selling, general
and administrative expense $23,180 $23,451 (1.2)%
Non-operating adjustments
Amortization of acquired
intangible assets (374) (370) 1.2
Acquisition-related charges (11) (25) (54.1)
Non-operating retirement-related
(costs)/income (257) (376) (31.7)
Operating (non-GAAP)
selling, general and
administrative expense $22,537 $22,680 (0.6)%
Total selling, general and administrative expense decreased
1.2percent in 2014 versus 2013 primarily driven by the following
factors:
• The effects of currency (2points); and
• Lower base expense (1 point); partially offset by
• Acquisition-related spending (2 points).
Operating (non-GAAP) SG&A expense decreased 0.6percent
primarily driven by:
• The effects of currency (2 points); partially offset by
• Acquisition-related spending (1 point).
Workforce rebalancing charges in 2014 were $1,472million, an
increase of $440million year to year, which resulted in a 2point
year-to-year impact in operating (non-GAAP) SG&A base
expense. Bad debt expense increased $178million year to year
driven by higher specific provision additions, primarily in China and
Latin America. The receivables provision coverage was 2.2per-
cent at December31, 2014, an increase of 60basis points from
year-end 2013.
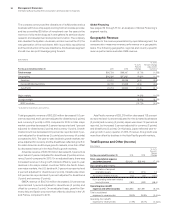
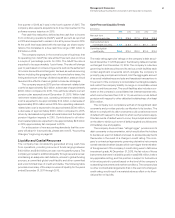
Research, Development and Engineering
($ inmillions)
For the year ended December 31: 2014 2013
Yr.-to-Yr.
Percent
Change
Total consolidated research,
development and engineering $5,437 $5,743 (5.3)%
Non-operating adjustment
Non-operating retirement-related
(costs)/income 77 (57) NM
Operating (non-GAAP) research,
development and engineering $5,514 $5,686 (3.0)%
NM—Not meaningful
Research, development and engineering expense was 5.9percent
of revenue in 2014 and 5.8percent of revenue in 2013.
RD&E expense decreased 5.3percent in 2014 year to year
primarily driven by:
• Lower base expense (7points); and
• The effects of currency (1point); partially offset by
• Higher expense due to acquisitions (2points).
Operating (non-GAAP) RD&E expense decreased 3.0percent in
2014 compared to the prior year, primarily driven by:
• Lower base expense (4points); and
• The effects of currency (1point); partially offset by
• Higher expense due to acquisitions (2points).
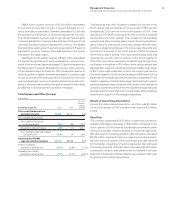
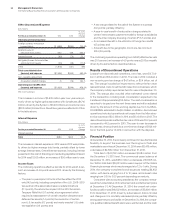
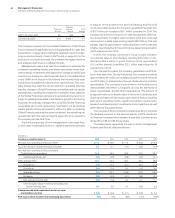
Intellectual Property and Custom Development Income
($ inmillions)
For the year ended December 31: 2014 2013
Yr.-to-Yr.
Percent
Change
Sales and other transfers of
intellectual property $283 $352 (19.7)%
Licensing/royalty-based fees 129 150 (13.9)
Custom development income 330 320 3.1
Total $742 $822 (9.8)%
The timing and amount of Sales and other transfers of IP may vary
significantly from period to period depending upon the timing of
divestitures, economic conditions, industry consolidation and the
timing of new patents and know-how development. There were no
significant individual IP transactions in 2014 or 2013.