IBM 2015 Annual Report Download - page 109
Download and view the complete annual report
Please find page 109 of the 2015 IBM annual report below. You can navigate through the pages in the report by either clicking on the pages listed below, or by using the keyword search tool below to find specific information within the annual report.-
 1
1 -
2
-
3
-
4
-
5
-
6
-
7
-
8
-
9
-
10
-
11
-
12
-
13
-
14
-
15
-
16
-
17
-
18
-
19
-
20
-
21
-
22
-
23
-
24
-
25
-
26
-
27
-
28
-
29
-
30
-
31
-
32
-
33
-
34
-
35
-
36
-
37
-
38
-
39
-
40
-
41
-
42
-
43
-
44
-
45
-
46
-
47
-
48
-
49
-
50
-
51
-
52
-
53
-
54
-
55
-
56
-
57
-
58
-
59
-
60
-
61
-
62
-
63
-
64
-
65
-
66
-
67
-
68
-
69
-
70
-
71
-
72
-
73
-
74
-
75
-
76
-
77
-
78
-
79
-
80
-
81
-
82
-
83
-
84
-
85
-
86
-
87
-
88
-
89
-
90
-
91
-
92
-
93
-
94
-
95
-
96
-
97
-
98
-
 99
99 -
 100
100 -
 101
101 -
 102
102 -
 103
103 -
 104
104 -
 105
105 -
 106
106 -
 107
107 -
 108
108 -
 109
109 -
 110
110 -
 111
111 -
 112
112 -
 113
113 -
 114
114 -
 115
115 -
 116
116 -
 117
117 -
 118
118 -
 119
119 -
120
-
121
-
122
-
123
-
124
-
125
-
126
-
127
-
128
-
129
-
130
-
131
-
132
-
133
-
134
-
135
-
136
-
137
-
138
-
139
-
140
-
141
-
142
-
143
-
144
-
145
-
146
-
147
-
148
-
149
-
150
-
151
-
152
-
153
-
154
-
155
-
156
 |
 |

107
Notes to Consolidated Financial Statements
International Business Machines Corporation and Subsidiary Companies
($ inmillions)
At December 31, 2014:
Major
Markets
Growth
Markets Total
Financing receivables
Lease receivables $ 5,702 $1,943 $ 7,645
Loan receivables 10,049 4,639 14,687
Ending balance $15,751 $6,581 $22,332
Collectively evaluated for impairment $15,665 $6,156 $21,821
Individually evaluated for impairment $ 86 $ 425 $ 511
Allowance for credit losses
Beginning balance at
January1, 2014
Lease receivables $ 42 $ 80 $ 123
Loan receivables 95 147 242
Total $ 137 $ 228 $ 365
Write-offs (18) (6) (24)
Provision 3 240 243
Other (12) (11) (23)
Ending balance at
December 31, 2014 $ 111 $ 450 $ 561
Lease receivables $ 32 $ 133 $ 165
Loan receivables $ 79 $ 317 $ 396
Collectively evaluated for impairment $ 42 $ 39 $ 81
Individually evaluated for impairment $ 69 $ 411 $ 480
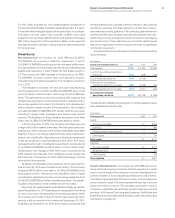
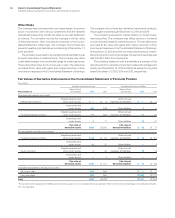
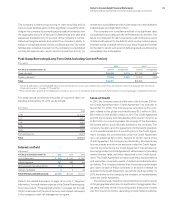
When determining the allowances, financing receivables are
evaluated either on an individual or a collective basis. For indi-
vidually evaluated receivables, the company determines the
expected cash flow for the receivable and calculates an estimate
of the potential loss and the probability of loss. For those accounts
in which the loss is probable, the company records a specific
reserve. In addition, the company records an unallocated reserve
that is calculated by applying a reserve rate to its different portfo-
lios, excluding accounts that have been specifically reserved. This
reserve rate is based upon credit rating, probability of default, term,
characteristics (lease/loan) and loss history.
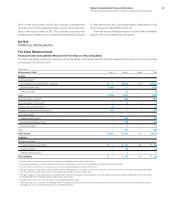
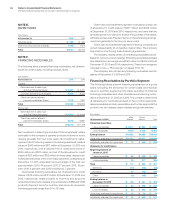
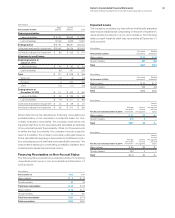
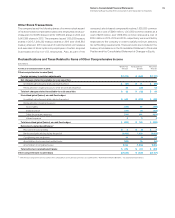
Financing Receivables on Non-Accrual Status
The following table presents the recorded investment in financing
receivables which were on non-accrual status at December31,
2015 and 2014.
($ inmillions)
At December 31: 2015 2014
Major markets $ 2 $ 13
Growth markets 63 40
Total lease receivables $ 65 $ 53
Major markets $ 13 $ 27
Growth markets 91 151
Total loan receivables $104 $178
Total receivables $168 $231
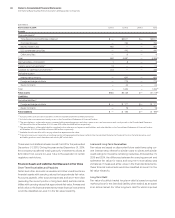
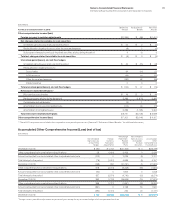
Impaired Loans
The company considers any loan with an individually evaluated
reserve as an impaired loan. Depending on the level of impairment,
loans will also be placed on a non-accrual status. The following
tables present impaired client loan receivables at December31,
2015 and 2014.
($ inmillions)
At December 31, 2015:
Recorded
Investment
Related
Allowance
Major markets $ 50 $ 47
Growth markets 297 284
Total $347 $331
($ inmillions)
At December 31, 2014:
Recorded
Investment
Related
Allowance
Major markets $ 54 $ 47
Growth markets 299 293
Total $353 $340
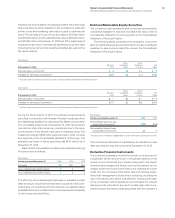
($ inmillions)
For the year ended December 31, 2015:
Average
Recorded
Investment
Interest
Income
Recognized
Interest
Income
Recognized
on Cash
Basis
Major markets $ 51 $0 $—
Growth markets 315 0 —
Total $367 $0 $—
($ inmillions)
For the year ended December 31, 2014:
Average
Recorded
Investment
Interest
Income
Recognized
Interest
Income
Recognized
on Cash
Basis
Major markets $ 68 $0 $—
Growth markets 208 0 —
Total $276 $0 $—