IBM 2015 Annual Report Download - page 49
Download and view the complete annual report
Please find page 49 of the 2015 IBM annual report below. You can navigate through the pages in the report by either clicking on the pages listed below, or by using the keyword search tool below to find specific information within the annual report.-
 1
1 -
2
-
3
-
4
-
5
-
6
-
7
-
8
-
9
-
10
-
11
-
12
-
13
-
14
-
15
-
16
-
17
-
18
-
19
-
20
-
21
-
22
-
23
-
24
-
25
-
26
-
27
-
28
-
29
-
30
-
31
-
32
-
33
-
34
-
35
-
36
-
37
-
38
-
 39
39 -
 40
40 -
 41
41 -
 42
42 -
 43
43 -
 44
44 -
 45
45 -
 46
46 -
 47
47 -
 48
48 -
 49
49 -
 50
50 -
 51
51 -
 52
52 -
 53
53 -
 54
54 -
 55
55 -
 56
56 -
 57
57 -
 58
58 -
 59
59 -
60
-
61
-
62
-
63
-
64
-
65
-
66
-
67
-
68
-
69
-
70
-
71
-
72
-
73
-
74
-
75
-
76
-
77
-
78
-
79
-
80
-
81
-
82
-
83
-
84
-
85
-
86
-
87
-
88
-
89
-
90
-
91
-
92
-
93
-
94
-
95
-
96
-
97
-
98
-
99
-
100
-
101
-
102
-
103
-
104
-
105
-
106
-
107
-
108
-
109
-
110
-
111
-
112
-
113
-
114
-
115
-
116
-
117
-
118
-
119
-
120
-
121
-
122
-
123
-
124
-
125
-
126
-
127
-
128
-
129
-
130
-
131
-
132
-
133
-
134
-
135
-
136
-
137
-
138
-
139
-
140
-
141
-
142
-
143
-
144
-
145
-
146
-
147
-
148
-
149
-
150
-
151
-
152
-
153
-
154
-
155
-
156
 |
 |

47
Management Discussion
International Business Machines Corporation and Subsidiary Companies
EMEA fourth quarter revenue of $7,320 million decreased
8.5percent as reported, but grew 1percent adjusted for cur-
rency on a year-to-year basis. Germany decreased 0.3percent
as reported, but had growth of 13percent adjusted for currency.
The UK decreased 1.4percent year to year as reported, but grew
3percent adjusted for currency. France declined 10.6percent as
reported, but grew 2percent adjusted for currency. The Middle
East and Africa region grew 2.6percent as reported and 8percent
adjusted for currency. However, there was a decline in the central
and eastern European region.
Asia Pacific fourth quarter revenue of $4,417 million decreased
9.8percent as reported and 3percent adjusted for currency com-
pared to the prior year. Japan decreased 2.6percent as reported,
but had growth of 3percent adjusted for currency, led by services.
On an adjusted basis, this was the 13th consecutive quarter of
revenue growth in Japan. Australia decreased 5.2percent year
to year, but returned to strong growth of 11percent in the fourth
quarter adjusted for currency. India also had strong growth com-
pared to the prior year. However, this growth was more than offset
by declines in China and other countries in the region.
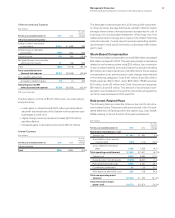
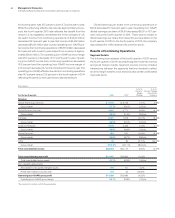
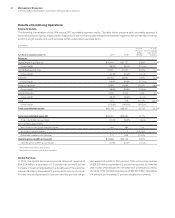
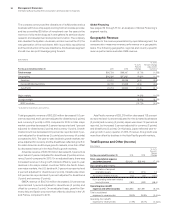
Total Expense and Other (Income)
($ inmillions)
For the fourth quarter: 2015 2014
Yr.-to-Yr.
Percent/
Margin
Change
Total consolidated expense
and other (income) $6,308 $5,767 9.4%
Non-operating adjustments
Amortization of acquired
intangible assets (80) (93) (13.7)
Acquisition-related charges (15) (2) 646.7
Non-operating retirement-related
(costs)/income (100) (74) 33.8
Operating (non-GAAP)
expense and other (income) $6,114 $5,598 9.2%
Total co nso lid ated
expense-to-revenue ratio 28.6% 23.9% 4.7 pts.
Operating (non-GAAP)
expense-to-revenue ratio 27.7% 23.2% 4.5 pts.
Total expense and other (income) increased 9.4percent in the
fourth quarter with an expense-to-revenue ratio of 28.6percent
compared to 23.9percent in the fourth quarter of 2014. Total
operating (non-GAAP) expense and other (income) increased
9.2percent in the fourth quarter. The increase in total operating
expense and other (income) was primarily driven by divestiture
gains in the prior-year period (24points), partially offset by lower
workforce rebalancing charges in the current year (10points) and
the impact of currency in the fourth quarter of 2015 compared
with the prior year (8points). There were several large items that
impacted the growth rate this quarter. In the fourth quarter of
2014, other (income) and expense included the pre-tax gain from
the Systemx divestiture of $1.4billion; while selling, general and
administrative expense included a workforce rebalancing charge
of $577million with essentially none in the current year period.
The fourth quarter of 2015 included a charge of $86million for the
impairment of the equity securities received as consideration in the
System x divestiture. Outside these larger items, the fourth-quarter
expense dynamics were consistent with the rest of the year as the
company accelerates shifts within the operational expense base
driving productivity and efficiency in some areas, while increasing
investment in support of the strategic imperatives.
Results of Discontinued Operations
Income from discontinued operations, net of tax, was $3million
in the fourth quarter of 2015 compared with a loss of $31million
in 2014.
Cash Flow
The company generated $5,278 million in cash flow provided by
operating activities, a decrease of $781million compared to the
fourth quarter of 2014 driven by operational performance within
net income, partially offset by declines in income tax payments.
Net cash used in investing activities of $5,445 million increased
$4,209 million compared to the prior year, primarily due to acqui-
sitions in the fourth quarter of the current year and cash received
for the Systemx divestiture in the prior year period. Net cash used
in financing activities of $1,348 million decreased $4,351 million
compared to the prior year, primarily due to a decline in net cash
payments to settle debt, partially offset by an increase in cash used
for gross common stock repurchases.