IBM 2015 Annual Report Download - page 113
Download and view the complete annual report
Please find page 113 of the 2015 IBM annual report below. You can navigate through the pages in the report by either clicking on the pages listed below, or by using the keyword search tool below to find specific information within the annual report.-
 1
1 -
2
-
3
-
4
-
5
-
6
-
7
-
8
-
9
-
10
-
11
-
12
-
13
-
14
-
15
-
16
-
17
-
18
-
19
-
20
-
21
-
22
-
23
-
24
-
25
-
26
-
27
-
28
-
29
-
30
-
31
-
32
-
33
-
34
-
35
-
36
-
37
-
38
-
39
-
40
-
41
-
42
-
43
-
44
-
45
-
46
-
47
-
48
-
49
-
50
-
51
-
52
-
53
-
54
-
55
-
56
-
57
-
58
-
59
-
60
-
61
-
62
-
63
-
64
-
65
-
66
-
67
-
68
-
69
-
70
-
71
-
72
-
73
-
74
-
75
-
76
-
77
-
78
-
79
-
80
-
81
-
82
-
83
-
84
-
85
-
86
-
87
-
88
-
89
-
90
-
91
-
92
-
93
-
94
-
95
-
96
-
97
-
98
-
99
-
100
-
101
-
102
-
 103
103 -
 104
104 -
 105
105 -
 106
106 -
 107
107 -
 108
108 -
 109
109 -
 110
110 -
 111
111 -
 112
112 -
 113
113 -
 114
114 -
 115
115 -
 116
116 -
 117
117 -
 118
118 -
 119
119 -
 120
120 -
 121
121 -
 122
122 -
 123
123 -
124
-
125
-
126
-
127
-
128
-
129
-
130
-
131
-
132
-
133
-
134
-
135
-
136
-
137
-
138
-
139
-
140
-
141
-
142
-
143
-
144
-
145
-
146
-
147
-
148
-
149
-
150
-
151
-
152
-
153
-
154
-
155
-
156
 |
 |

Notes to Consolidated Financial Statements
International Business Machines Corporation and Subsidiary Companies
111
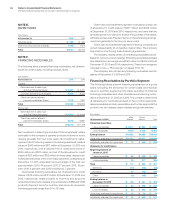
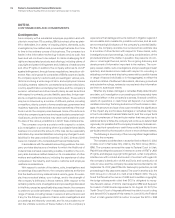
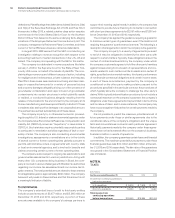
Goodwill
The changes in the goodwill balances by reportable segment, for the years ended December31, 2015 and 2014, are as follows:
($ inmillions)
Segment
Balance
January1,
2015
Goodwill
Additions
Purchase
Price
Adjustments Divestitures
Foreign
Currency
Transl ation
and Other
Adjustments*
Balance
December 31,
2015
Global Business Services $ 4,555 $ 74 $ 0 $ (1) $ (232) $ 4,396
Global Technology Services 3,530 694 0 — (90) 4,133
Software 21,000 1,413 (2) (25) (741) 21,644
Systems Hardware 1,472 410 0 — (33) 1,848
Total $30,556 $2,590 $ (3) $(26) $(1,096) $32,021
* Primarily driven by foreign currency translation.
($ inmillions)
Segment
Balance
January1,
2014
Goodwill
Additions
Purchase
Price
Adjustments Divestitures
Foreign
Currency
Transl ation
and Other
Adjustments**
Balance
December 31,
2014
Global Business Services* $ 4,855 $ — $ 0 $ (52) $(248) $ 4,555
Global Technology Services* 3,608 11 21 (2) (108) 3,530
Software 21,121 430 $(17) (19) (516) 21,000
Systems Hardware 1,601 — — (110) (19) 1,472
Total $31,184 $442 $ 4 $(183) $(891 ) $30,556
* Reclassified to conform with 2015 presentation with $469million reclassified from GTS to GBS at December 31, 2014 for Global Process Services.
** Primarily driven by foreign currency translation.
Purchase price adjustments recorded in 2015 and 2014 were
related to acquisitions that were completed on or prior to Decem-
ber31, 2014 or December31, 2013, respectively, and were still
subject to the measurement period that ends at the earlier of 12
months from the acquisition date or when information becomes
available. There were no goodwill impairment losses recorded
in 2015 or 2014 and the company has no accumulated goodwill
impairment losses.
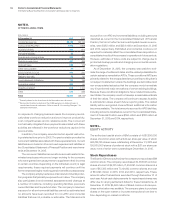
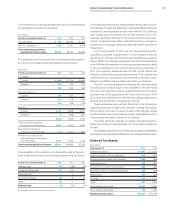
NOTEJ.
BORROWINGS
Short-Term Debt
($ inmillions)
At December 31: 2015 2014
Commercial paper $ 600 $ 650
Short-term loans 590 480
Long-term debt—current maturities 5,271 4,601*
Total $6,461 $5,731 *
* Reclassified to reflect adoption of the FASB guidance on debt issuance costs
in consolidated financial statements. Refer to noteB, “Accounting Changes,” for
additional information.
The weighted-average interest rate for commercial paper at
December31, 2015 and 2014 was 0.4percent and 0.1percent,
respectively. The weighted-average interest rates for short-term
loans was 5.2percent and 4.0percent at December31, 2015 and
2014, respectively.