IBM 2015 Annual Report Download - page 56
Download and view the complete annual report
Please find page 56 of the 2015 IBM annual report below. You can navigate through the pages in the report by either clicking on the pages listed below, or by using the keyword search tool below to find specific information within the annual report.-
 1
1 -
2
-
3
-
4
-
5
-
6
-
7
-
8
-
9
-
10
-
11
-
12
-
13
-
14
-
15
-
16
-
17
-
18
-
19
-
20
-
21
-
22
-
23
-
24
-
25
-
26
-
27
-
28
-
29
-
30
-
31
-
32
-
33
-
34
-
35
-
36
-
37
-
38
-
39
-
40
-
41
-
42
-
43
-
44
-
45
-
 46
46 -
 47
47 -
 48
48 -
 49
49 -
 50
50 -
 51
51 -
 52
52 -
 53
53 -
 54
54 -
 55
55 -
 56
56 -
 57
57 -
 58
58 -
 59
59 -
 60
60 -
 61
61 -
 62
62 -
 63
63 -
 64
64 -
 65
65 -
 66
66 -
67
-
68
-
69
-
70
-
71
-
72
-
73
-
74
-
75
-
76
-
77
-
78
-
79
-
80
-
81
-
82
-
83
-
84
-
85
-
86
-
87
-
88
-
89
-
90
-
91
-
92
-
93
-
94
-
95
-
96
-
97
-
98
-
99
-
100
-
101
-
102
-
103
-
104
-
105
-
106
-
107
-
108
-
109
-
110
-
111
-
112
-
113
-
114
-
115
-
116
-
117
-
118
-
119
-
120
-
121
-
122
-
123
-
124
-
125
-
126
-
127
-
128
-
129
-
130
-
131
-
132
-
133
-
134
-
135
-
136
-
137
-
138
-
139
-
140
-
141
-
142
-
143
-
144
-
145
-
146
-
147
-
148
-
149
-
150
-
151
-
152
-
153
-
154
-
155
-
156
 |
 |

54 Management Discussion
International Business Machines Corporation and Subsidiary Companies
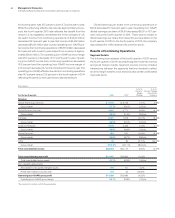
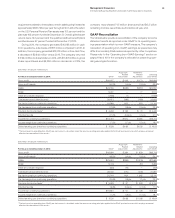
Software
($ inmillions)
For the year ended December 31: 2014 2013
Yr.-to-Yr.
Percent
Change
Yr.-to-Yr.
Percent Change
Adjusted for
Currency
Software external revenue $25,434 $25,932 (1.9)% (0.9)%
Middleware $21,474 $21,557 (0.4)% 0.6%
Key branded middleware 17,098 17,322 (1.3) (0.2)
WebSphere 2.7 3.5
Information Management (4.1) (3.0)
Workforce Solutions (6.1) (5.1)
Tivoli 2.0 3.0
Rational (3.3) (1.3)
Other middleware 4,376 4,235 3.3 4.2
Operating systems 2,119 2,447 (13.4) (12.6)
Other 1,841 1,929 (4.5) (3.7)
Software revenue of $25,434 million decreased 1.9percent (1per-
cent adjusted for currency) in 2014 compared to 2013. Middleware
decreased 0.4percent (increased 1percent adjusted for currency)
while operating systems were down 13.4percent (13percent
adjusted for currency). The decline in operating systems impacted
total software revenue growth year to year at constant currency by
approximately 1point. The company had solid growth in many of
its solution areas, including security, mobile and cloud. In addition,
across the software brands, SaaS offerings grew rapidly through-
out the year, increasing approximately 50percent compared to
2013. In the first quarter of 2014, the company launched Bluemix,
a cloud Platform-as-a Service for the enterprise and, during the
year, the Software business completed five acquisitions adding to
its capabilities in mobile, cloud and security. Across Software, the
company is transitioning its portfolio to capture growth areas while
continuing to drive innovation in its core franchises. It is growing
and building capabilities in emerging areas like SaaS, mobile and
security. Performance in 2014 reflected business model changes
that impacted the transactional revenue growth. Given clients’
substantial investment in the IBM software platform, the com-
pany has been providing more flexibility on how clients deploy
its software acquired through enterprise licensing agreements.
This enables clients to more effectively manage their capacity and
commit to the company’s platforms for the long term, however, it
does impact period transactional revenue.
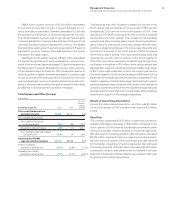
Key branded middleware revenue accounted for 67percent of
total Software revenue in 2014. While there was growth in several
strategic areas like cloud, mobile and security, other parts of the
portfolio declined on a year-to-year basis.
WebSphere revenue performance was driven by growth in
Application Server, Business Integration and Commerce offerings.
In Commerce, there was strong momentum in Commerce-as-a-
Service, which included the acquisitions of Silverpop and Aspera.
MobileFirst, the comprehensive portfolio of mobile software and
services that enable clients to manage, integrate and leverage
mobile devices, contributed to the significant growth of the com-
pany’s mobile business.
Within Information Management, with the acquisition of Clou-
dant, the company has added Database-as-a-Service capability.
Cloudant extends the company’s mobile and cloud platforms by
enabling developers to easily and quickly create next-generation
mobile and Web-based applications.
Workforce Solutions revenue performance was impacted by
the transition from on premise Notes to SaaS offerings. The com-
pany is working to transform this business and build recurring
revenue streams from the SaaS offerings.
Year-to-year revenue growth in Tivoli was driven by security
software which grew at double digit rates. As cybersecurity threats
are a key issue faced by all customers, these strong results were
driven in part by incremental requirements for security with the
expansion into cloud and mobile computing.
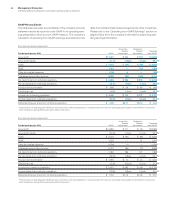
Operating systems revenue decline was primarily driven by
declines in Power Systems.
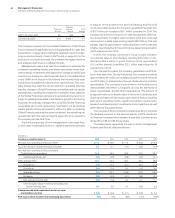
($ inmillions)
For the year ended December 31: 2014 2013
Yr.-to-Yr.
Percent/
Margin
Change
Software
External gross profi t $22,533 $23,032 (2.2)%
External gross profi t margin 88.6% 88.8% (0.2 ) pts.
Pre-tax income $10,699 $11,106 (3.7)%
Pre-tax margin 37.0% 38.1% (1.2 ) pts.
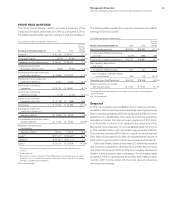
Across software, the company continued to drive innovation and
capture growth areas, integrating analytics and security capabili-
ties that are needed to operate seamlessly in a hybrid environment.
For example, the company introduced several new offerings that