IBM 2015 Annual Report Download - page 127
Download and view the complete annual report
Please find page 127 of the 2015 IBM annual report below. You can navigate through the pages in the report by either clicking on the pages listed below, or by using the keyword search tool below to find specific information within the annual report.-
 1
1 -
2
-
3
-
4
-
5
-
6
-
7
-
8
-
9
-
10
-
11
-
12
-
13
-
14
-
15
-
16
-
17
-
18
-
19
-
20
-
21
-
22
-
23
-
24
-
25
-
26
-
27
-
28
-
29
-
30
-
31
-
32
-
33
-
34
-
35
-
36
-
37
-
38
-
39
-
40
-
41
-
42
-
43
-
44
-
45
-
46
-
47
-
48
-
49
-
50
-
51
-
52
-
53
-
54
-
55
-
56
-
57
-
58
-
59
-
60
-
61
-
62
-
63
-
64
-
65
-
66
-
67
-
68
-
69
-
70
-
71
-
72
-
73
-
74
-
75
-
76
-
77
-
78
-
79
-
80
-
81
-
82
-
83
-
84
-
85
-
86
-
87
-
88
-
89
-
90
-
91
-
92
-
93
-
94
-
95
-
96
-
97
-
98
-
99
-
100
-
101
-
102
-
103
-
104
-
105
-
106
-
107
-
108
-
109
-
110
-
111
-
112
-
113
-
114
-
115
-
116
-
 117
117 -
 118
118 -
 119
119 -
 120
120 -
 121
121 -
 122
122 -
 123
123 -
 124
124 -
 125
125 -
 126
126 -
 127
127 -
 128
128 -
 129
129 -
 130
130 -
 131
131 -
 132
132 -
 133
133 -
 134
134 -
 135
135 -
 136
136 -
 137
137 -
138
-
139
-
140
-
141
-
142
-
143
-
144
-
145
-
146
-
147
-
148
-
149
-
150
-
151
-
152
-
153
-
154
-
155
-
156
 |
 |

Notes to Consolidated Financial Statements
International Business Machines Corporation and Subsidiary Companies
125
Committee. Awards that are given as part of annual total compen-
sation for senior management and other employees are made on
specific cycle dates scheduled in advance. With respect to awards
given in connection with promotions or new hires, the company’s
policy requires approval of such awards prior to the grant date,
which is typically the date of the promotion or the date of hire.
Stock Awards
Stock awards are made in the form of Restricted Stock Units
(RSUs), including Retention Restricted Stock Units (RRSUs), or
Performance Share Units (PSUs).
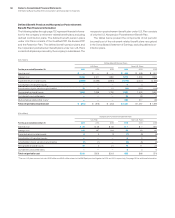
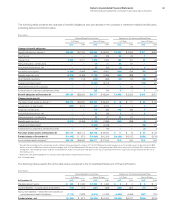
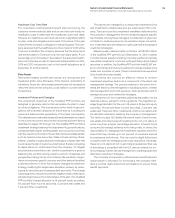
The tables below summarize RSU and PSU activity under the
Plans during the years ended December31, 2015, 2014 and 2013.
RSUs
2015 2014 2013
Weighted-
Average
Grant Price
Number
of Units
Weighted-
Average
Grant Price
Number
of Units
Weighted-
Average
Grant Price
Number
of Units
Balance at January1 $171 7,734,277 $166 8,635,317 $148 9,841,461
RSUs granted 143 4,230,186 172 2,525,947 189 2,541,081
RSUs released 164 (3,567,495) 157 (2,401,761) 131 (2,952,363)
RSUs canceled/forfeited 167 (869,627) 167 (1,025,226) 154 (794,862)
Balance at December 31 $159 7,527,341 $171 7,734,277 $166 8,635,317
PSUs
2015 2014 2013
Weighted-
Average
Grant Price
Number
of Units
Weighted-
Average
Grant Price
Number
of Units
Weighted-
Average
Grant Price
Number
of Units
Balance at January1 $185 3,140,707 $178 2,824,294 $151 3,172,201
PSUs granted at target 153 1,137,242 180 1,430,098 195 869,875
Performance adjustments* 185 (168,055) 157 29,960 118 152,069
PSUs released 185 (840,552) 157 (1,027,181) 118 (1,321,784)
PSUs canceled/forfeited 184 (340,410) 187 (116,464) 170 (48,067)
Balance at December 31** $173 2,928,932 $185 3,140,707 $178 2,824,294
* Represents the change in shares issued to employees after vesting of PSUs because final performance metrics were above or below specified targets.
** Represents the number of shares expected to be issued based on achievement of grant date performance targets. The actual number of shares issued will depend on final
performance against specified targets over the vesting period.
RSUs are stock awards granted to employees that entitle the
holder to shares of common stock as the award vests, typically
over a one- to five-year period. For RSUs, dividend equivalents
are not paid. The fair value of such RSUs is determined and fixed
on the grant date based on the company’s stock price adjusted
for the exclusion of dividend equivalents.
The remaining weighted-average contractual term of RSUs
at December31, 2015, 2014 and 2013 is the same as the period
over which the remaining cost of the awards will be recognized,
which is approximately three years. The fair value of RSUs granted
during the years ended December31, 2015, 2014 and 2013 was
$606million, $434million and $481million, respectively. The total
fair value of RSUs vested and released during the years ended
December31, 2015, 2014 and 2013 was $583million, $378mil-
lion and $386million, respectively. As of December31, 2015, 2014
and 2013, there was $800million, $754million and $871million,
respectively, of unrecognized compensation cost related to non-
vested RSUs. The company received no cash from employees
as a result of employee vesting and release of RSUs for the years
ended December31, 2015, 2014 and 2013.