IBM 2015 Annual Report Download - page 78
Download and view the complete annual report
Please find page 78 of the 2015 IBM annual report below. You can navigate through the pages in the report by either clicking on the pages listed below, or by using the keyword search tool below to find specific information within the annual report.-
 1
1 -
2
-
3
-
4
-
5
-
6
-
7
-
8
-
9
-
10
-
11
-
12
-
13
-
14
-
15
-
16
-
17
-
18
-
19
-
20
-
21
-
22
-
23
-
24
-
25
-
26
-
27
-
28
-
29
-
30
-
31
-
32
-
33
-
34
-
35
-
36
-
37
-
38
-
39
-
40
-
41
-
42
-
43
-
44
-
45
-
46
-
47
-
48
-
49
-
50
-
51
-
52
-
53
-
54
-
55
-
56
-
57
-
58
-
59
-
60
-
61
-
62
-
63
-
64
-
65
-
66
-
67
-
 68
68 -
 69
69 -
 70
70 -
 71
71 -
 72
72 -
 73
73 -
 74
74 -
 75
75 -
 76
76 -
 77
77 -
 78
78 -
 79
79 -
 80
80 -
 81
81 -
 82
82 -
 83
83 -
 84
84 -
 85
85 -
 86
86 -
 87
87 -
 88
88 -
89
-
90
-
91
-
92
-
93
-
94
-
95
-
96
-
97
-
98
-
99
-
100
-
101
-
102
-
103
-
104
-
105
-
106
-
107
-
108
-
109
-
110
-
111
-
112
-
113
-
114
-
115
-
116
-
117
-
118
-
119
-
120
-
121
-
122
-
123
-
124
-
125
-
126
-
127
-
128
-
129
-
130
-
131
-
132
-
133
-
134
-
135
-
136
-
137
-
138
-
139
-
140
-
141
-
142
-
143
-
144
-
145
-
146
-
147
-
148
-
149
-
150
-
151
-
152
-
153
-
154
-
155
-
156
 |
 |

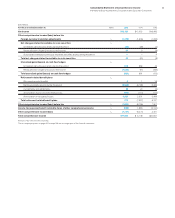
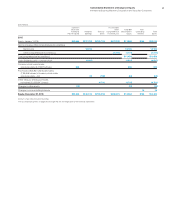
76 Consolidated Statement of Earnings
International Business Machines Corporation and Subsidiary Companies
($ inmillions except per share amounts)
For the year ended December 31: Notes 2015 2014 2013
Revenue
Services $49,911 $55,673 $57,655
Sales 29,967 35,063 38,666
Financing 1,864 2,057 2,047
Total revenue T81,741 92,793 98,367
Cost
Services 33,126 36,034 37,564
Sales 6,920 9,312 11,009
Financing 1,011 1,040 1,110
Total cost 41,057 46,386 49,683
Gross profi t 40,684 46,407 48,684
Expense and other (income)
Selling, general and administrative 20,430 23,180 23,451
Research, development and engineering O5,247 5,437 5,743
Intellectual property and custom development income (682) (742) (822)
Other (income) and expense (724) (1,938) (333)
Interest expense D&J 468 484 402
Total expense and other (income) 24,740 26,421 28,440
Income from continuing operations before income taxes 15,945 19,986 20,244
Provision for income taxes N2,581 4,234 3,363
Income from continuing operations 13,364 15,751 16,881
Loss from discontinued operations, net of tax C(174) (3,729) (398)
Net income $13,190 $12,022 $16,483
Earnings/(loss) per share of common stock
Assuming dilution
Continuing operations P$ 13.60 $ 15.59 $ 15.30
Discontinued operations P(0.18) (3.69) (0.36)
Total P$ 13.42 $ 11.90 $ 14.94
Basic
Continuing operations P$ 13.66 $ 15.68 $ 15.42
Discontinued operations P(0.18) (3.71) (0.36)
Total P$ 13.48 $ 11.97 $ 15.06
Weighted-average number of common shares outstanding
Assuming dilution 982,700,267 1,010,000,480 1,103,042,156
Basic 978,744,523 1,004,272,584 1,094,486,604
Amounts may not add due to rounding.
The accompanying notes on pages 82 through 146 are an integral part of the financial statements.