IBM 2015 Annual Report Download - page 126
Download and view the complete annual report
Please find page 126 of the 2015 IBM annual report below. You can navigate through the pages in the report by either clicking on the pages listed below, or by using the keyword search tool below to find specific information within the annual report.-
 1
1 -
2
-
3
-
4
-
5
-
6
-
7
-
8
-
9
-
10
-
11
-
12
-
13
-
14
-
15
-
16
-
17
-
18
-
19
-
20
-
21
-
22
-
23
-
24
-
25
-
26
-
27
-
28
-
29
-
30
-
31
-
32
-
33
-
34
-
35
-
36
-
37
-
38
-
39
-
40
-
41
-
42
-
43
-
44
-
45
-
46
-
47
-
48
-
49
-
50
-
51
-
52
-
53
-
54
-
55
-
56
-
57
-
58
-
59
-
60
-
61
-
62
-
63
-
64
-
65
-
66
-
67
-
68
-
69
-
70
-
71
-
72
-
73
-
74
-
75
-
76
-
77
-
78
-
79
-
80
-
81
-
82
-
83
-
84
-
85
-
86
-
87
-
88
-
89
-
90
-
91
-
92
-
93
-
94
-
95
-
96
-
97
-
98
-
99
-
100
-
101
-
102
-
103
-
104
-
105
-
106
-
107
-
108
-
109
-
110
-
111
-
112
-
113
-
114
-
115
-
 116
116 -
 117
117 -
 118
118 -
 119
119 -
 120
120 -
 121
121 -
 122
122 -
 123
123 -
 124
124 -
 125
125 -
 126
126 -
 127
127 -
 128
128 -
 129
129 -
 130
130 -
 131
131 -
 132
132 -
 133
133 -
 134
134 -
 135
135 -
 136
136 -
137
-
138
-
139
-
140
-
141
-
142
-
143
-
144
-
145
-
146
-
147
-
148
-
149
-
150
-
151
-
152
-
153
-
154
-
155
-
156
 |
 |

Notes to Consolidated Financial Statements
International Business Machines Corporation and Subsidiary Companies
124
Weighted-average stock options to purchase 41,380 common
shares in 2015, 17,420 common shares in 2014 and 8,797 common
shares in 2013 were outstanding, but were not included in the com-
putation of diluted earnings per share because the exercise price
of the options was greater than the average market price of the
common shares for the full year, and therefore, the effect would
have been antidilutive.
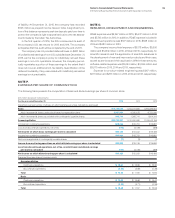
NOTEQ.
RENTAL EXPENSE AND LEASE COMMITMENTS
Rental expense, including amounts charged to inventories and
fixed assets, and excluding amounts previously reserved, was
$1,474 million in 2015, $1,592 million in 2014 and $1,759 million in
2013. Within these amounts, rental expense reflected in discon-
tinued operations was $29million, $95million and $115million, in
2015, 2014 and 2013, respectively. Rental expense in agreements
with rent holidays and scheduled rent increases is recorded on
a straight-line basis over the lease term. Contingent rentals are
included in the determination of rental expense as accruable.
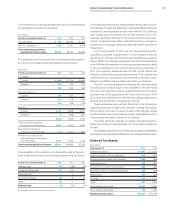
The table below depicts gross minimum rental commitments
under noncancelable leases, amounts related to vacant space
associated with infrastructure reductions, sublease income com-
mitments and capital lease commitments. These amounts reflect
activities primarily related to office space, as well as data centers.
($ inmillions)
2016 2017 2018 2019 2020 Beyond 2020
Operating lease commitments
Gross minimum rental commitments
(including vacant space below) $1,347 $1,231 $1,107 $985 $776 $988
Vacant space $ 14 $ 4 $ 1 $ — $ — $ —
Sublease income commitments $ 11 $ 7 $ 5 $ 4 $ 1 $ 1
Capital lease commitments $ 7 $ 2 $ 2 $ 2 $ 1 $ —
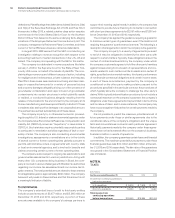
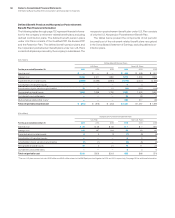
NOTER.
STOCK-BASED COMPENSATION
The following table presents total stock-based compensation cost
included in income from continuing operations.
($ inmillions)
For the year ended December 31: 2015 2014 2013
Cost $ 100 $ 121 $ 122
Selling, general and administrative 322 350 435
Research, development
and engineering 51 54 57
Other (income) and expense* (6) (13 )—
Pre-tax stock-based
compensation cost 468 512 614
Income tax benefi ts (156) (174) (213)
Net stock-based
compensation cost $ 312 $ 338 $ 402
* Reflects the one-time effects related to divestitures.
The amount of stock-based compensation cost included in dis-
continued operations, net of tax, was immaterial in all periods.
Total unrecognized compensation cost related to non-vested
awards at December31, 2015 and 2014 was $871million and
$874million, respectively. The amount at December31, 2015 is
expected to be recognized over a weighted-average period of
approximately 2.7years.
There was no significant capitalized stock-based compensa-
tion cost at December31, 2015, 2014 and 2013.
Incentive Awards
Stock-based incentive awards are provided to employees under
the terms of the company’s long-term performance plans (the
“Plans”). The Plans are administered by the Executive Compen-
sation and Management Resources Committee of the Board of
Directors (the “Committee”). Awards available under the Plans
principally include restricted stock units, performance share units,
stock options or any combination thereof.
The amount of shares originally authorized to be issued under
the company’s existing Plans was 274million at December31,
2015. In addition, certain incentive awards granted under previ-
ous plans, if and when those awards were canceled, could be
reissued under the company’s existing Plans. As such, 66.2million
additional awards were considered authorized to be issued under
the company’s existing Plans as of December31, 2015. There were
111.6million unused shares available to be granted under the Plans
as of December31, 2015.
Under the company’s long-standing practices and policies, all
awards are approved prior to or on the date of grant. The awards
approval process specifies the individual receiving the grant, the
number of options or the value of the award, the exercise price or
formula for determining the exercise price and the date of grant.
All awards for senior management are approved by the Commit-
tee. All awards for employees other than senior management are
approved by senior management pursuant to a series of delega-
tions that were approved by the Committee, and the grants made
pursuant to these delegations are reviewed periodically with the