IBM 2015 Annual Report Download - page 123
Download and view the complete annual report
Please find page 123 of the 2015 IBM annual report below. You can navigate through the pages in the report by either clicking on the pages listed below, or by using the keyword search tool below to find specific information within the annual report.-
 1
1 -
2
-
3
-
4
-
5
-
6
-
7
-
8
-
9
-
10
-
11
-
12
-
13
-
14
-
15
-
16
-
17
-
18
-
19
-
20
-
21
-
22
-
23
-
24
-
25
-
26
-
27
-
28
-
29
-
30
-
31
-
32
-
33
-
34
-
35
-
36
-
37
-
38
-
39
-
40
-
41
-
42
-
43
-
44
-
45
-
46
-
47
-
48
-
49
-
50
-
51
-
52
-
53
-
54
-
55
-
56
-
57
-
58
-
59
-
60
-
61
-
62
-
63
-
64
-
65
-
66
-
67
-
68
-
69
-
70
-
71
-
72
-
73
-
74
-
75
-
76
-
77
-
78
-
79
-
80
-
81
-
82
-
83
-
84
-
85
-
86
-
87
-
88
-
89
-
90
-
91
-
92
-
93
-
94
-
95
-
96
-
97
-
98
-
99
-
100
-
101
-
102
-
103
-
104
-
105
-
106
-
107
-
108
-
109
-
110
-
111
-
112
-
 113
113 -
 114
114 -
 115
115 -
 116
116 -
 117
117 -
 118
118 -
 119
119 -
 120
120 -
 121
121 -
 122
122 -
 123
123 -
 124
124 -
 125
125 -
 126
126 -
 127
127 -
 128
128 -
 129
129 -
 130
130 -
 131
131 -
 132
132 -
 133
133 -
134
-
135
-
136
-
137
-
138
-
139
-
140
-
141
-
142
-
143
-
144
-
145
-
146
-
147
-
148
-
149
-
150
-
151
-
152
-
153
-
154
-
155
-
156
 |
 |

Notes to Consolidated Financial Statements
International Business Machines Corporation and Subsidiary Companies
121
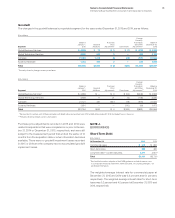
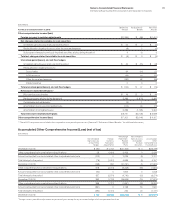
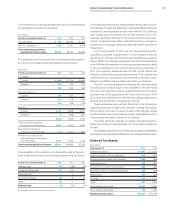
The income from continuing operations provision for income taxes
by geographic operations is as follows:
($ inmillions)
For the year ended December 31: 2015 2014 2013
U.S. operations $ 849 $2,093 $1,315
Non-U.S. operations 1,732 2,141 2,048
Total continuing operations
provision for income taxes $2,581 $4,234 $3,363
The components of the income from continuing operations provi-
sion for income taxes by taxing jurisdiction are as follows:
($ inmillions)
For the year ended December 31: 2015 2014 2013
U.S. federal
Current $ (321) $ 1,134 $1,694
Deferred 553 105 (708)
232 1,239 986
U.S. state and local
Current 128 541 277
Deferred 116 (105) (330)
244 436 (53)
Non-U.S.
Current 2,101 2,825 3,067
Deferred 4(266) (637)
2,105 2,559 2,430
Total continuing operations
provision for income taxes 2,581 4,234 3,363
Discontinued operations
provision for income taxes (117) (1,617) (322)
Provision for social security,
real estate, personal property
and other taxes 3,497 4,068 4,198
Total taxes included in net income $5,961 $ 6,685 $7,238
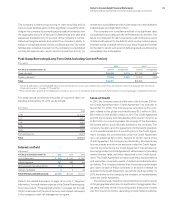
A reconciliation of the statutory U.S. federal tax rate to the com-
pany’s effective tax rate from continuing operations is as follows:
For the year ended December 31: 2015 2014 2013
Statutory rate 35% 35% 35%
Foreign tax differential (17) (14) (13)
State and local 110
Domestic incentives (2) (2) (3)
Other (1) 1 (2)
Effective rate 16% 21% 17%
Percentages rounded for disclosure purposes.
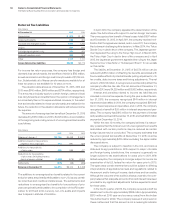
The significant components reflected within the tax rate reconcili-
ation labeled “Foreign tax differential” include the effects of foreign
subsidiaries’ earnings taxed at rates other than the U.S. statutory
rate, foreign export incentives, the U.S. tax impacts of non-U.S.
earnings repatriation and any net impacts of intercompany trans-
actions. These items also reflect audit settlements or changes in
the amount of unrecognized tax benefits associated with each of
these items.
In the fourth quarter of 2015, the U.S. Internal Revenue Ser-
vice (IRS) concluded its examination of the company’s income
tax returns for 2011 and 2012 and issued a final Revenue Agent’s
Report (RAR). The company has agreed with all of the adjustments
in the RAR with the exception of the proposed adjustments related
to the tax implications of an internal restructuring undertaken in
2011. The company disagrees with the IRS on this matter and
intends to protest the proposed adjustments. The company has
redetermined its unrecognized tax benefits for all open years,
based on the RAR and associated information and analysis.
The 2015 continuing operations effective tax rate decreased
5.0points from 2014 as a result of: the completion of the 2011–2012
U.S. tax audit, including reserve redeterminations (3.9points),
a benefit due to the geographic mix of pre-tax income in 2015
(3.5points) and a benefit due to the 2014 tax charge related to the
divestiture of the Systemx business (0.9points).
These decreases were partially offset due to the following: a
reduced benefit year to year in the utilization of foreign tax credits
(2.5points) and the year-to-year increase in tax charges related
to intercompany payments made by foreign subsidiaries and the
intercompany licensing of certain IP (0.8points).
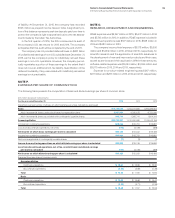
The effect of tax law changes on deferred tax assets and lia-
bilities did not have a material impact on the company’s effective
tax rate.
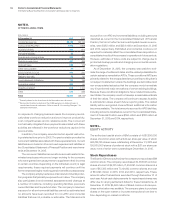
The significant components of deferred tax assets and liabilities
recorded in the Consolidated Statement of Financial Position were:
Deferred Tax Assets
($ inmillions)
At December 31: 2015 2014
Retirement benefi ts $ 4,621 $ 4,795
Share-based and other compensation 963 1,328
Domestic tax loss/credit carryforwards 1,066 858
Deferred income 762 957
Foreign tax loss/credit carryforwards 825 686
Bad debt, inventory and warranty reserves 528 529
Depreciation 329 329
Accruals 904 1,176
Other 931 1,306
Gross deferred tax assets 10,929 11,964
Less: valuation allowance 740 646
Net deferred tax assets $10,189 $11,318