IBM 2015 Annual Report Download - page 50
Download and view the complete annual report
Please find page 50 of the 2015 IBM annual report below. You can navigate through the pages in the report by either clicking on the pages listed below, or by using the keyword search tool below to find specific information within the annual report.-
 1
1 -
2
-
3
-
4
-
5
-
6
-
7
-
8
-
9
-
10
-
11
-
12
-
13
-
14
-
15
-
16
-
17
-
18
-
19
-
20
-
21
-
22
-
23
-
24
-
25
-
26
-
27
-
28
-
29
-
30
-
31
-
32
-
33
-
34
-
35
-
36
-
37
-
38
-
39
-
 40
40 -
 41
41 -
 42
42 -
 43
43 -
 44
44 -
 45
45 -
 46
46 -
 47
47 -
 48
48 -
 49
49 -
 50
50 -
 51
51 -
 52
52 -
 53
53 -
 54
54 -
 55
55 -
 56
56 -
 57
57 -
 58
58 -
 59
59 -
 60
60 -
61
-
62
-
63
-
64
-
65
-
66
-
67
-
68
-
69
-
70
-
71
-
72
-
73
-
74
-
75
-
76
-
77
-
78
-
79
-
80
-
81
-
82
-
83
-
84
-
85
-
86
-
87
-
88
-
89
-
90
-
91
-
92
-
93
-
94
-
95
-
96
-
97
-
98
-
99
-
100
-
101
-
102
-
103
-
104
-
105
-
106
-
107
-
108
-
109
-
110
-
111
-
112
-
113
-
114
-
115
-
116
-
117
-
118
-
119
-
120
-
121
-
122
-
123
-
124
-
125
-
126
-
127
-
128
-
129
-
130
-
131
-
132
-
133
-
134
-
135
-
136
-
137
-
138
-
139
-
140
-
141
-
142
-
143
-
144
-
145
-
146
-
147
-
148
-
149
-
150
-
151
-
152
-
153
-
154
-
155
-
156
 |
 |

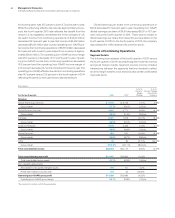
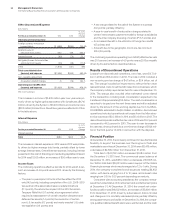
48 Management Discussion
International Business Machines Corporation and Subsidiary Companies
($ inmillions except per share amount)
For the fourth quarter 2015: GAAP
Acquisition-
Related
Adjustments
Retirement-
Related
Adjustments
Operating
(non-GAAP)
Gross profi t $11,407 $ 105 $ 119 $11,630
Gross profi t margin 51.7% 0.5 pts. 0.5 pts. 52.7%
SG&A $ 5,157 $ (95) $ (88) $ 4,975
RD&E 1,362 — (12) 1,350
Other (income) and expense (146) 0 — (146)
Total expense and other (income) 6,308 (95) (100) 6,114
Pre-tax income from continuing operations $ 5,098 $ 199 $ 218 $ 5,516
Pre-tax margin from continuing operations 23.1% 0.9 pts. 1.0 pts. 25.0%
Provision for income taxes* $ 638 $ 89 $ 82 $ 809
Effective tax rate 12.5% 1.2 pts. 1.0 pts. 14.7%
Income from continuing operations $ 4,460 $ 110 $ 137 $ 4,707
Income margin from continuing operations 20.2% 0.5 pts. 0.6 pts. 21.3%
Diluted earnings per share from continuing operations $ 4.59 $0.11 $0.14 $ 4.84
* The tax impact on operating (non-GAAP) pre-tax income from continuing operations is calculated under the same accounting principles applied to the GAAP pre-tax income
which employs an annual effective tax rate method to the results.
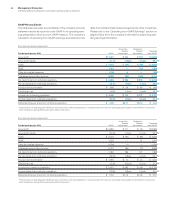
($ inmillions except per share amount)
For the fourth quarter 2014: GAAP
Acquisition-
Related
Adjustments
Retirement-
Related
Adjustments
Operating
(non-GAAP)
Gross profi t $12,862 $ 101 $ 33 $12,996
Gross profi t margin 53.3% 0.4 pts. 0.1 pts. 53.9%
SG&A $ 6,034 $ (94) $ (95) $ 5,845
RD&E 1,320 — 21 1,341
Other (income) and expense (1,506) (1) — (1,506)
Total expense and other (income) 5,767 (95) (74) 5,598
Pre-tax income from continuing operations 7,094 196 107 7,398
Pre-tax margin from continuing operations 29.4% 0.8 pts. 0.4 pts. 30.7%
Provision for income taxes* $ 1,580 $ 10 $ 24 $ 1,613
Effective tax rate 22.3% (0.5) pts. 0.0 pts. 21.8%
Income from continuing operations $ 5,515 $ 186 $ 84 $ 5,785
Income margin from continuing operations 22.9% 0.8 pts. 0.3 pts. 24.0%
Diluted earnings per share from continuing operations $ 5.54 $0.19 $0.08 $ 5.81
* The tax impact on operating (non-GAAP) pre-tax income from continuing operations is calculated under the same accounting principles applied to the GAAP pre-tax income
which employs an annual effective tax rate method to the results.
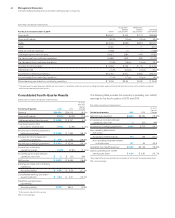
GAAP Reconciliation
The tables below provide a reconciliation of the company’s income
statement results as reported under GAAP to its operating earn-
ings presentation which is a non-GAAP measure. The company’s
calculation of operating (non-GAAP) earnings, as presented, may
differ from similarly titled measures reported by other companies.
Please refer to the “Operating (non-GAAP) Earnings” section on
pages 18 and 19 for the company’s rationale for presenting oper-
ating earnings information.