IBM 2015 Annual Report Download - page 125
Download and view the complete annual report
Please find page 125 of the 2015 IBM annual report below. You can navigate through the pages in the report by either clicking on the pages listed below, or by using the keyword search tool below to find specific information within the annual report.-
 1
1 -
2
-
3
-
4
-
5
-
6
-
7
-
8
-
9
-
10
-
11
-
12
-
13
-
14
-
15
-
16
-
17
-
18
-
19
-
20
-
21
-
22
-
23
-
24
-
25
-
26
-
27
-
28
-
29
-
30
-
31
-
32
-
33
-
34
-
35
-
36
-
37
-
38
-
39
-
40
-
41
-
42
-
43
-
44
-
45
-
46
-
47
-
48
-
49
-
50
-
51
-
52
-
53
-
54
-
55
-
56
-
57
-
58
-
59
-
60
-
61
-
62
-
63
-
64
-
65
-
66
-
67
-
68
-
69
-
70
-
71
-
72
-
73
-
74
-
75
-
76
-
77
-
78
-
79
-
80
-
81
-
82
-
83
-
84
-
85
-
86
-
87
-
88
-
89
-
90
-
91
-
92
-
93
-
94
-
95
-
96
-
97
-
98
-
99
-
100
-
101
-
102
-
103
-
104
-
105
-
106
-
107
-
108
-
109
-
110
-
111
-
112
-
113
-
114
-
 115
115 -
 116
116 -
 117
117 -
 118
118 -
 119
119 -
 120
120 -
 121
121 -
 122
122 -
 123
123 -
 124
124 -
 125
125 -
 126
126 -
 127
127 -
 128
128 -
 129
129 -
 130
130 -
 131
131 -
 132
132 -
 133
133 -
 134
134 -
 135
135 -
136
-
137
-
138
-
139
-
140
-
141
-
142
-
143
-
144
-
145
-
146
-
147
-
148
-
149
-
150
-
151
-
152
-
153
-
154
-
155
-
156
 |
 |

Notes to Consolidated Financial Statements
International Business Machines Corporation and Subsidiary Companies
123
of liability. At December31, 2015, the company has recorded
$526million as prepaid income taxes in India. A significant por-
tion of this balance represents cash tax deposits paid over time to
protect the company’s right to appeal various income tax assess-
ments made by the Indian Tax Authorities.
In the first quarter of 2016, the IRS commenced its audit of
the company’s U.S. tax returns for 2013 and 2014. The company
anticipates that this audit will be completed by the end of 2017.
The company has not provided deferred taxes on $68.1billion
of undistributed earnings of non-U.S. subsidiaries at December31,
2015, as it is the company’s policy to indefinitely reinvest these
earnings in non-U.S. operations. However, the company period-
ically repatriates a portion of these earnings to the extent that it
does not incur an additional U.S. tax liability. Quantification of the
deferred tax liability, if any, associated with indefinitely reinvested
earnings is not practicable.
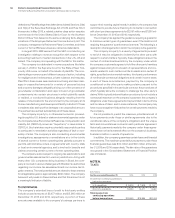
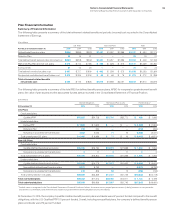
NOTEO.
RESEARCH, DEVELOPMENT AND ENGINEERING
RD&E expense was $5,247 million in 2015, $5,437 million in 2014
and $5,743 million in 2013. In addition, RD&E expense included in
discontinued operations was $197million in 2015, $368million in
2014 and $483million in 2013.
The company incurred total expense of $5,178 million, $5,595
million and $5,959 million in 2015, 2014 and 2013, respectively, for
scientific research and the application of scientific advances to
the development of new and improved products and their uses,
as well as services and their application. Within these amounts,
software-related expense was $3,064 million, $3,064 million and
$3,077 million in 2015, 2014 and 2013, respectively.
Expense for product-related engineering was $267million,
$211million and $267million in 2015, 2014 and 2013, respectively.
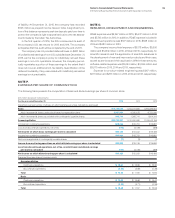
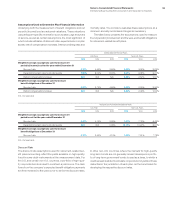
NOTEP.
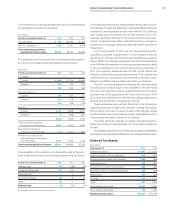
EARNINGS PER SHARE OF COMMON STOCK
The following table presents the computation of basic and diluted earnings per share of common stock.
($ inmillions except per share amounts)
For the year ended December 31: 2015 2014 2013
Weighted-average number of shares on which earnings per share calculations are based
Basic 978,744,523 1,004,272,584 1,094,486,604
Add—incremental shares under stock-based compensation plans 3,037,001 4,332,155 6,751,240
Add—incremental shares associated with contingently issuable shares 918,744 1,395,741 1,804,313
Assuming dilution 982,700,267 1,010,000,480 1,103,042,156
Income from continuing operations $13,364 $15,751 $16,881
Loss from discontinued operations, net of tax (174) (3,729) (398)
Net income on which basic earnings per share is calculated $13,190 $12,022 $16,483
Income from continuing operations $13,364 $15,751 $16,881
Net income applicable to contingently issuable shares (1) (3) (1)
Income from continuing operations on which diluted earnings per share is calculated $13,363 $15,749 $16,880
Loss from discontinued operations, net of tax, on which basic and diluted earnings
per share is calculated (174) (3,729 ) (398 )
Net income on which diluted earnings per share is calculated $13,189 $12,020 $16,483
Earnings/(loss) per share of common stock
Assuming dilution
Continuing operations $ 13.60 $ 15.59 $ 15.30
Discontinued operations (0.18) (3.69) (0.36)
Total $ 13.42 $ 11.90 $ 14.94
Basic
Continuing operations $ 13.66 $ 15.68 $ 15.42
Discontinued operations (0.18) (3.71) (0.36)
Total $ 13.48 $ 11.97 $ 15.06