IBM 2015 Annual Report Download - page 72
Download and view the complete annual report
Please find page 72 of the 2015 IBM annual report below. You can navigate through the pages in the report by either clicking on the pages listed below, or by using the keyword search tool below to find specific information within the annual report.-
 1
1 -
2
-
3
-
4
-
5
-
6
-
7
-
8
-
9
-
10
-
11
-
12
-
13
-
14
-
15
-
16
-
17
-
18
-
19
-
20
-
21
-
22
-
23
-
24
-
25
-
26
-
27
-
28
-
29
-
30
-
31
-
32
-
33
-
34
-
35
-
36
-
37
-
38
-
39
-
40
-
41
-
42
-
43
-
44
-
45
-
46
-
47
-
48
-
49
-
50
-
51
-
52
-
53
-
54
-
55
-
56
-
57
-
58
-
59
-
60
-
61
-
 62
62 -
 63
63 -
 64
64 -
 65
65 -
 66
66 -
 67
67 -
 68
68 -
 69
69 -
 70
70 -
 71
71 -
 72
72 -
 73
73 -
 74
74 -
 75
75 -
 76
76 -
 77
77 -
 78
78 -
 79
79 -
 80
80 -
 81
81 -
 82
82 -
83
-
84
-
85
-
86
-
87
-
88
-
89
-
90
-
91
-
92
-
93
-
94
-
95
-
96
-
97
-
98
-
99
-
100
-
101
-
102
-
103
-
104
-
105
-
106
-
107
-
108
-
109
-
110
-
111
-
112
-
113
-
114
-
115
-
116
-
117
-
118
-
119
-
120
-
121
-
122
-
123
-
124
-
125
-
126
-
127
-
128
-
129
-
130
-
131
-
132
-
133
-
134
-
135
-
136
-
137
-
138
-
139
-
140
-
141
-
142
-
143
-
144
-
145
-
146
-
147
-
148
-
149
-
150
-
151
-
152
-
153
-
154
-
155
-
156
 |
 |

70 Management Discussion
International Business Machines Corporation and Subsidiary Companies
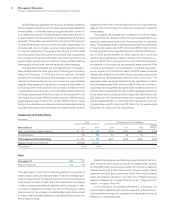
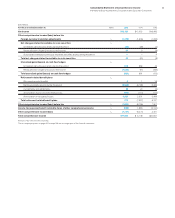
Total revenue in 2015 decreased $45million versus 2014 as a
result of:
• A decrease in external revenue of 9.5percent (up 1.5percent
adjusted for currency) driven by decreases in financing reve-
nue (down 10.2percent to $1,386 million) and used equipment
sales revenue (down 7.6percent to $454million); partially
offset by
• An increase in internal revenue of 6.0percent driven by an
increase in used equipment sales revenue (up 10.7percent to
$2,303 million); partially offset by a decrease in financing
revenue (down 18.3percent to $334million).
The decrease in internal and external financing revenue was pri-
marily due to decreases in the average asset balance and yields,
as well as a decrease in remarketing lease revenue. Global Financ-
ing gross profit decreased 0.9percent compared to 2014 due to
a decrease in financing gross profit, partially offset by an increase
in used equipment sales gross profit. The gross profit margin was
flat compared to 2014 due to an increase in the equipment sales
margin, offset by a shift in mix away from higher margin financing
and a decrease in the financing margin.
Total revenue in 2014 increased $218million versus 2013 as a
result of:
• An increase in internal revenue of 9.0percent driven by an
increase in used equipment sales revenue (up 11.1percent to
$2,080 million); partially offset by a decrease in financing
revenue (down 0.7percent to $408million); and
• An increase in external revenue of 0.6percent (up 3percent
adjusted for currency) driven by an increase in financing
revenue (up 3.4percent to $1,543 million), partially offset by
a decrease in used equipment sales revenue (down 7.2per-
cent to $491million).
The decrease in internal financing revenue was primarily due to
lower asset yields, partially offset by an increase in the average
asset balance. The increase in external financing revenue was
due to a higher average asset balance, partially offset by lower
asset yields and a decrease in remarketing lease revenue. Global
Financing gross profit increased 7.2percent compared to 2013 due
to an increase in used equipment sales gross profit, partially offset
by a decrease in financing gross profit. The gross profit margin
increased 1.3points due to an increase in the equipment sales
margin, partially offset by a decrease in the financing margin.
Global Financing pre-tax income increased 8.0percent in
2015 versus 2014, following an increase of 0.8percent in 2014
versus 2013. The increase in 2015 was driven by decreases in
SG&A expenses ($107million) and financing receivables provi-
sions ($96million), partially offset by the decrease in gross profit
($29million). The increase in 2014 was driven by the increase in
gross profit ($207million), partially offset by increases in financing
receivables provisions ($155million) and SG&A expenses ($32mil-
lion). The decrease in financing receivable provisions in 2015 was
due to lower specific reserve requirements, primarily in China
and Latin America. At December31, 2015, the overall allowance
for credit losses coverage rate was 2.1percent, an increase of
23basispoints year over year.
The increase in return on equity from the period 2014 to 2015
was driven by the increase in net income and a lower average
equity balance. The decrease in return on equity from the period
2013 to 2014 was driven by a higher average equity balance.
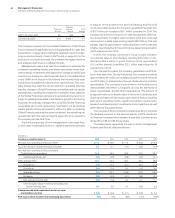
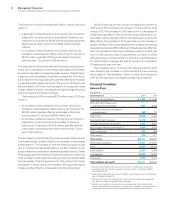
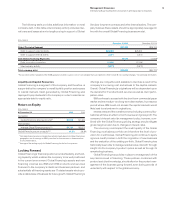
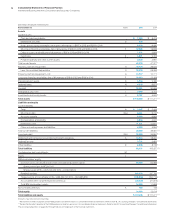
Financial Condition
Balance Sheet
($ inmillions)
At December 31: 2015 2014
Cash and cash equivalents $ 1,555 $ 1,538
Net investment in sales-type
and direct fi nancing leases 7,594 8,263
Equipment under operating leases—
external clients
(1) 605 774
Client loans 12,525 14,290
Total client fi nancing assets 20,725 23,327
Commercial fi nancing receivables 8,948 8,424
Intercompany fi nancing receivables
(2) (3) 4,245 4,611
Other receivables 308 368
Other assets 378 577
Total assets $36,157 $38,845
Intercompany payables
(2) $ 3,089 $ 3,631
Debt
(4) 27,205 29,103
Other liabilities 2,134 2,094
Total liabilities 32,428 34,828
Total eq uit y 3,729 4,017
Total liabilities and equity $36,157 $38,845
(1) Includes intercompany mark-up, priced on an arm’s-length basis, on products
purchased from the company’s product divisions, which is eliminated in IBM’s
consolidated results.
(2) Entire amount eliminated for purposes of IBM’s consolidated results and therefore
does not appear on page78.
(3) These assets, along with all other financing assets in this table, are leveraged at
the value in the table using Global Financing debt.
(4) Global Financing debt is comprised of intercompany loans and external debt.
A portion of Global Financing debt is in support of the company’s internal business,
or related to intercompany mark-up embedded in the Global Financing assets.