IBM 2015 Annual Report Download - page 110
Download and view the complete annual report
Please find page 110 of the 2015 IBM annual report below. You can navigate through the pages in the report by either clicking on the pages listed below, or by using the keyword search tool below to find specific information within the annual report.-
 1
1 -
2
-
3
-
4
-
5
-
6
-
7
-
8
-
9
-
10
-
11
-
12
-
13
-
14
-
15
-
16
-
17
-
18
-
19
-
20
-
21
-
22
-
23
-
24
-
25
-
26
-
27
-
28
-
29
-
30
-
31
-
32
-
33
-
34
-
35
-
36
-
37
-
38
-
39
-
40
-
41
-
42
-
43
-
44
-
45
-
46
-
47
-
48
-
49
-
50
-
51
-
52
-
53
-
54
-
55
-
56
-
57
-
58
-
59
-
60
-
61
-
62
-
63
-
64
-
65
-
66
-
67
-
68
-
69
-
70
-
71
-
72
-
73
-
74
-
75
-
76
-
77
-
78
-
79
-
80
-
81
-
82
-
83
-
84
-
85
-
86
-
87
-
88
-
89
-
90
-
91
-
92
-
93
-
94
-
95
-
96
-
97
-
98
-
99
-
 100
100 -
 101
101 -
 102
102 -
 103
103 -
 104
104 -
 105
105 -
 106
106 -
 107
107 -
 108
108 -
 109
109 -
 110
110 -
 111
111 -
 112
112 -
 113
113 -
 114
114 -
 115
115 -
 116
116 -
 117
117 -
 118
118 -
 119
119 -
 120
120 -
121
-
122
-
123
-
124
-
125
-
126
-
127
-
128
-
129
-
130
-
131
-
132
-
133
-
134
-
135
-
136
-
137
-
138
-
139
-
140
-
141
-
142
-
143
-
144
-
145
-
146
-
147
-
148
-
149
-
150
-
151
-
152
-
153
-
154
-
155
-
156
 |
 |

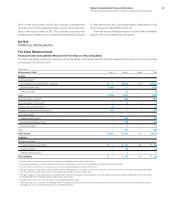
Notes to Consolidated Financial Statements
International Business Machines Corporation and Subsidiary Companies
108
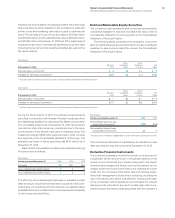
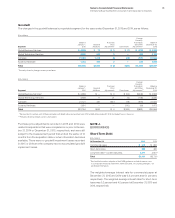
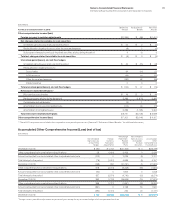
Credit Quality Indicators
The company’s credit quality indicators, which are based on rating
agency data, publicly available information and information pro-
vided by customers, are reviewed periodically based on the relative
level of risk. The resulting indicators are a numerical rating system
that maps to Moody’s Investors Service credit ratings as shown
below. The company uses information provided by Moody’s, where
available, as one of many inputs in its determination of customer
credit rating.
The tables present the gross recorded investment for each
class of receivables, by credit quality indicator, at December31,
2015 and 2014. Receivables with a credit quality indicator ranging
from Aaa to Baa3 are considered investment grade. All others are
considered non-investment grade. The credit quality indicators do
not reflect mitigation actions that the company may take to transfer
credit risk to third parties.
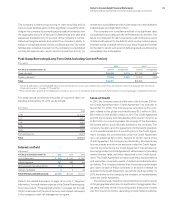
Lease Receivables
($ inmillions)
At December 31, 2015:
Major
Markets
Growth
Markets
Credit rating
Aaa – Aa3 $ 538 $ 39
A1 – A 3 1,324 162
Baa1 – Baa3 1,493 392
Ba1 – Ba2 1,214 352
Ba3 – B1 513 277
B2 – B3 403 215
Caa – D 33 87
Total $5,517 $1,524
Loan Receivables
($ inmillions)
At December 31, 2015:
Major
Markets
Growth
Markets
Credit rating
Aaa – Aa3 $ 949 $ 80
A1 – A 3 2,338 336
Baa1 – Baa3 2,635 813
Ba1 – Ba2 2,143 732
Ba3 – B1 905 576
B2 – B3 711 447
Caa – D 59 181
Total $9,739 $3,165
At December31, 2015, the industries which made up Global
Financing’s receivables portfolio consisted of: Financial (36per-
cent), Manufacturing (14percent), Government (11 percent),
Services (11percent), Retail (9percent), Communications (7per-
cent), Healthcare (6percent) and Other (6percent).
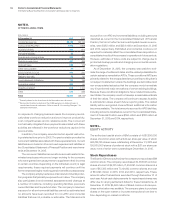
Lease Receivables
($ inmillions)
At December 31, 2014:
Major
Markets
Growth
Markets
Credit rating
Aaa – Aa3 $ 563 $ 46
A1 – A 3 1,384 178
Baa1 – Baa3 1,704 900
Ba1 – Ba2 1,154 272
Ba3 – B1 470 286
B2 – B3 372 176
Caa – D 55 85
Total $5,702 $1,943
Loan Receivables
($ inmillions)
At December 31, 2014:
Major
Markets
Growth
Markets
Credit rating
Aaa – Aa3 $ 993 $ 110
A1 – A 3 2,438 425
Baa1 – Baa3 3,003 2,148
Ba1 – Ba2 2,034 649
Ba3 – B1 827 683
B2 – B3 655 420
Caa – D 98 203
Total $10,049 $4,639
At December31, 2014, the industries which made up Global
Financing’s receivables portfolio consisted of: Financial (40per-
cent), Manufacturing (14percent), Government (13percent),
Services (9percent), Retail (8percent), Communications (6per-
cent), Healthcare (5percent) and Other (5percent).