IBM 2015 Annual Report Download - page 23
Download and view the complete annual report
Please find page 23 of the 2015 IBM annual report below. You can navigate through the pages in the report by either clicking on the pages listed below, or by using the keyword search tool below to find specific information within the annual report.-
 1
1 -
2
-
3
-
4
-
5
-
6
-
7
-
8
-
9
-
10
-
11
-
12
-
 13
13 -
 14
14 -
 15
15 -
 16
16 -
 17
17 -
 18
18 -
 19
19 -
 20
20 -
 21
21 -
 22
22 -
 23
23 -
 24
24 -
 25
25 -
 26
26 -
 27
27 -
 28
28 -
 29
29 -
 30
30 -
 31
31 -
 32
32 -
 33
33 -
34
-
35
-
36
-
37
-
38
-
39
-
40
-
41
-
42
-
43
-
44
-
45
-
46
-
47
-
48
-
49
-
50
-
51
-
52
-
53
-
54
-
55
-
56
-
57
-
58
-
59
-
60
-
61
-
62
-
63
-
64
-
65
-
66
-
67
-
68
-
69
-
70
-
71
-
72
-
73
-
74
-
75
-
76
-
77
-
78
-
79
-
80
-
81
-
82
-
83
-
84
-
85
-
86
-
87
-
88
-
89
-
90
-
91
-
92
-
93
-
94
-
95
-
96
-
97
-
98
-
99
-
100
-
101
-
102
-
103
-
104
-
105
-
106
-
107
-
108
-
109
-
110
-
111
-
112
-
113
-
114
-
115
-
116
-
117
-
118
-
119
-
120
-
121
-
122
-
123
-
124
-
125
-
126
-
127
-
128
-
129
-
130
-
131
-
132
-
133
-
134
-
135
-
136
-
137
-
138
-
139
-
140
-
141
-
142
-
143
-
144
-
145
-
146
-
147
-
148
-
149
-
150
-
151
-
152
-
153
-
154
-
155
-
156
 |
 |

21
Management Discussion
International Business Machines Corporation and Subsidiary Companies
In the area of engagement, revenue increased 64percent as
reported and 77percent adjusted for currency. Security revenue
increased 5percent as reported (12percent adjusted for cur-
rency), mobile revenue more than tripled year to year and social
revenue increased 14percent as reported (21percent adjusted
for currency).
From a segment perspective, Global Services revenue
declined 10.5percent as reported and 1percent adjusted for
currency (9points) and divestitures. Global Technology Services
(GTS) declined 9.7percent as reported, but increased 1percent
year to year adjusted for currency (10points) and the Systemx
divestiture with strong growth in the strategic imperatives on
an adjusted basis. Global Business Services (GBS) revenue
decreased 12.0percent as reported and 4percent adjusted for
currency (8points). GBS revenue continues to be impacted by
the shift away from traditional large enterprise application imple-
mentations. Software revenue declined 9.8percent as reported
and 4percent adjusted for currency with growth in annuity-based
revenue, including Software-as-a-Service (SaaS), more than
offset by declines in transactional revenue reflecting the flexi-
bility the company has provided to its largest enterprise clients.
Systems Hardware revenue decreased 24.2percent as reported,
but increased 8percent adjusted for the Systemx divestiture
(28points) and currency (4points), reflecting a successful main-
frame cycle in 2015 and the repositioning of Power Systems to
address a broader opportunity.
From a geographic perspective, revenue in the major markets
declined 9.9percent as reported and 1percent adjusted for cur-
rency (8points) and divestitures (2points) with growth in Germany,
Japan and the UK on an adjusted basis. Growth markets revenue
decreased 18.4percent as reported and 3percent adjusted for
currency (9points) and divestitures (6points). On an adjusted
basis, declines in Asia Pacific were partially offset by growth in
Latin America and Middle East and Africa.
The consolidated gross profit margin of 49.8percent
decreased 0.2points year to year. The operating (non-GAAP)
gross margin of 50.8percent increased 0.2points compared to
the prior year primarily driven by the shift to higher value through
portfolio actions and the relative strength of zSystems, partially
offset by margin declines in Global Services and Software.
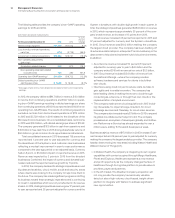
Total expense and other (income) decreased 6.4percent in
2015 compared to the prior year. Total operating (non-GAAP)
expense and other (income) decreased 7.8percent compared to
2014. The key year-to-year drivers were:
Total Operating
Consolidated (non-GAAP)
• Currency* (9) points (9) points
• Systemx divestiture (2) points (2) points
• Divestiture gains 6 points 6 points
• Workforce rebalancing (3) points (3) points
* Reflects impacts of translation and hedging programs.
The reduction in expense was driven primarily by currency
impacts, a lower level of workforce rebalancing charges and the
impact of the divested Systemx business. These benefits were
partially offset by the impact of lower divestiture gains ($1.6billion)
year to year. The reduction in operating (non-GAAP) expense was
driven primarily by the same factors. The company is continuing
to shift resources and spending within its operational expense
base—driving productivity and efficiency in some areas while
increasing investment in support of the strategic imperatives. In
2015, the company shifted over $5billion of spending across cost,
expense and capital expenditures, to the strategic imperatives.
Pre-tax income from continuing operations of $15.9billion in
2015 decreased 20.2percent year to year and the pre-tax margin
was 19.5percent, a decrease of 2.0points. The continuing oper-
ations effective tax rate for 2015 was 16.2percent, a decrease
of 5.0points versus 2014. The tax rate in 2015 reflected benefits
from the settlement of the U.S. tax audit and geographic mix of
pre-tax profits, partially offset by less utilization of foreign tax cred-
its. Income from continuing operations of $13.4billion decreased
15.2percent and the net income margin was 16.3percent, a
decrease of 0.6points versus 2014. Losses from discontin-
ued operations, net of tax, were $174million in 2015 compared
to $3,729 million in 2014. Net income of $13.2billion increased
9.7percent year to year. Operating (non-GAAP) pre-tax income
from continuing operations decreased 16.3percent year to year
and the operating (non-GAAP) pre-tax margin from continu-
ing operations decreased 1.1points to 21.6percent. Operating
(non-GAAP) income from continuing operations of $14.7billion
decreased 12.2percent including an impact of 7points from the
2014 gains from the Systemx and customer care divestitures. The
operating (non-GAAP) income margin from continuing operations
of 17.9percent decreased 0.1points. The operating (non-GAAP)
effective tax rate from continuing operations in 2015 was 17.2per-
cent versus 21.0percent in 2014. The 2015 profit and margin
performance reflect portfolio actions taken as the company shifts
to higher value, as well as investments being made to add capa-
bilities to drive the transformation.
Diluted earnings per share from continuing operations of $13.60
in 2015 decreased 12.8percent year to year. In 2015, the company
repurchased 30.3million shares of its common stock at a cost of
$4.7billion. Operating (non-GAAP) diluted earnings per share of
$14.92 decreased 9.7percent versus 2014 including an impact
of 7points from the 2014 gains from the Systemx and customer
care divestitures. Diluted earnings per share from discontinued
operations was ($0.18) in 2015 compared to ($3.69) in 2014.