IBM 2015 Annual Report Download - page 48
Download and view the complete annual report
Please find page 48 of the 2015 IBM annual report below. You can navigate through the pages in the report by either clicking on the pages listed below, or by using the keyword search tool below to find specific information within the annual report.-
 1
1 -
2
-
3
-
4
-
5
-
6
-
7
-
8
-
9
-
10
-
11
-
12
-
13
-
14
-
15
-
16
-
17
-
18
-
19
-
20
-
21
-
22
-
23
-
24
-
25
-
26
-
27
-
28
-
29
-
30
-
31
-
32
-
33
-
34
-
35
-
36
-
37
-
 38
38 -
 39
39 -
 40
40 -
 41
41 -
 42
42 -
 43
43 -
 44
44 -
 45
45 -
 46
46 -
 47
47 -
 48
48 -
 49
49 -
 50
50 -
 51
51 -
 52
52 -
 53
53 -
 54
54 -
 55
55 -
 56
56 -
 57
57 -
 58
58 -
59
-
60
-
61
-
62
-
63
-
64
-
65
-
66
-
67
-
68
-
69
-
70
-
71
-
72
-
73
-
74
-
75
-
76
-
77
-
78
-
79
-
80
-
81
-
82
-
83
-
84
-
85
-
86
-
87
-
88
-
89
-
90
-
91
-
92
-
93
-
94
-
95
-
96
-
97
-
98
-
99
-
100
-
101
-
102
-
103
-
104
-
105
-
106
-
107
-
108
-
109
-
110
-
111
-
112
-
113
-
114
-
115
-
116
-
117
-
118
-
119
-
120
-
121
-
122
-
123
-
124
-
125
-
126
-
127
-
128
-
129
-
130
-
131
-
132
-
133
-
134
-
135
-
136
-
137
-
138
-
139
-
140
-
141
-
142
-
143
-
144
-
145
-
146
-
147
-
148
-
149
-
150
-
151
-
152
-
153
-
154
-
155
-
156
 |
 |
46 Management Discussion
International Business Machines Corporation and Subsidiary Companies
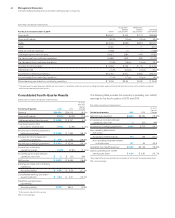
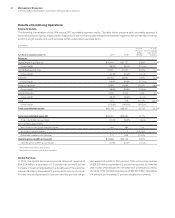
adjusted for currency) and Rational decreased 31.6percent
(28percent adjusted for currency). Other middleware decreased
14.0percent as reported and 9percent adjusted for currency.
Operating systems decreased 12.2percent as reported and
7percent adjusted for currency.
While the transactional performance in the quarter was
consistent with the third quarter of the year; the fourth quarter
has a higher transactional mix. This had a larger impact on total
software performance resulting in a deceleration in the software
performance in the fourth quarter. Many large clients with multi-
year contracts continue to utilize the flexibility on deployment of
their software as they build out their environments with the com-
pany’s broad portfolio. Outside the company’s top 250clients,
software revenue increased low single digits adjusted for currency
in the quarter.
The Software gross profit margin decreased 2.0points to
88.0percent in the fourth quarter of 2015 compared to the prior
year. Software pre-tax income of $2,959 million in the fourth quar-
ter decreased 21.4percent, with a pre-tax margin of 39.4percent,
a decrease of 5.3points. Profit performance in Software con-
tinues to reflect the overall revenue trajectory, a higher level of
investments in areas like Watson, Watson Health, Watson IoT and
Bluemix, and an impact from currency translation.
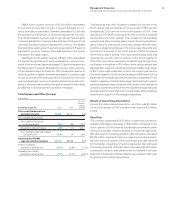
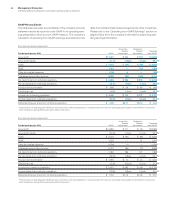
Systems Hardware
In the fourth quarter of 2015, Systems Hardware revenue of $2,372
million decreased 1.4percent as reported but grew 3percent
adjusted for currency compared to the prior year period. This
was the fourth consecutive quarter of growth in both zSystems
and Power Systems, adjusted for currency. zSystems revenue
increased 15.6percent as reported and 21percent adjusted for
currency. MIPS shipments increased 28percent year to year. Since
the launch of z13 in the first quarter of 2015, there has been strong
double-digit revenue growth on an adjusted basis in every quar-
ter of the year. Power Systems revenue increased 3.8percent as
reported and 8percent adjusted for currency in the fourth quar-
ter compared to the prior year. This was the strongest quarterly
performance during 2015. In Power, the company continues to
serve a high-value market while adding capabilities and finding
new economic models to grow over time. However, in the fourth
quarter the strong growth in servers was mitigated by a year-to-
year decline in Storage. Storage revenue decreased 11.2percent
as reported and 7percent adjusted for currency and continued to
be impacted by weakness in traditional disk and tape.
The Systems Hardware gross profit margin of 48.0percent
decreased 1.6points in the fourth quarter of 2015 compared to
the prior year. The decrease was due to margin (4.3points) driven
by zSystems, partially offset by a more favorable product mix.
Systems Hardware pre-tax income of $349million in the fourth
quarter decreased 10.1percent year to year with a pre-tax margin
of 13.9percent, down 1.5points year to year.
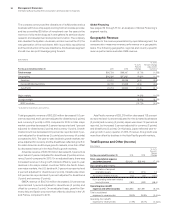
Global Financing
Global Financing Revenue of $454million was down 14.6per-
cent as reported and 6percent adjusted for currency due to
decreases in financing revenue and used equipment sales reve-
nue. The Global Financing fourth quarter pre-tax income increased
28.3percent to $674million and the pre-tax margin increased
8.5points to 55.4percent. The increase in pre-tax income was
driven by an increase in gross profit ($97million) and decreases in
financing receivable provisions ($41million) and SG&A expenses
($11million).
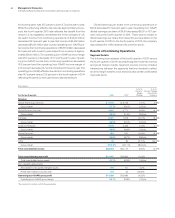
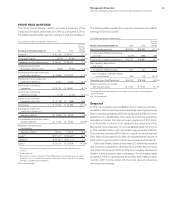
Geographic Revenue
Total geographic revenue of $21,988 million decreased 8.3per-
cent as reported and 2percent adjusted for currency in the fourth
quarter of 2015 compared to the prior year. Major market countries
decreased 6.9percent as reported and 2percent adjusted for
currency. Adjusted for currency, Europe returned to growth, led by
continued growth in Germany, France and the UK. In Asia Pacific,
Japan continued to grow year to year, adjusted for currency. U.S.
revenue was down in the fourth quarter compared to the prior
year. Overall, growth market countries decreased 13.6percent as
reported and 4percent adjusted for currency, relatively consistent
with the previous two quarters. From a regional perspective, on an
adjusted basis, growth in Latin America and the Middle East and
Africa region was more than offset by declines in the Asia Pacific
growth market countries.
Americas revenue of $10,251 million decreased 7.6percent as
reported and 4percent adjusted for currency compared to the
fourth quarter of 2014 with a decline in North America and growth
in Latin America on an adjusted basis. The U.S. decreased 5.5per-
cent year to year. Although there was strong growth in the U.S. in
Systems Hardware, it was offset by weak services and transac-
tional software performance. Canada was down 14.6percent as
reported and was flat adjusted for currency. In Latin America, on
an adjusted basis, there was growth across a number of the larger
countries including Brazil, Mexico, Argentina, and Colombia.