IBM 2015 Annual Report Download - page 40
Download and view the complete annual report
Please find page 40 of the 2015 IBM annual report below. You can navigate through the pages in the report by either clicking on the pages listed below, or by using the keyword search tool below to find specific information within the annual report.-
 1
1 -
2
-
3
-
4
-
5
-
6
-
7
-
8
-
9
-
10
-
11
-
12
-
13
-
14
-
15
-
16
-
17
-
18
-
19
-
20
-
21
-
22
-
23
-
24
-
25
-
26
-
27
-
28
-
29
-
 30
30 -
 31
31 -
 32
32 -
 33
33 -
 34
34 -
 35
35 -
 36
36 -
 37
37 -
 38
38 -
 39
39 -
 40
40 -
 41
41 -
 42
42 -
 43
43 -
 44
44 -
 45
45 -
 46
46 -
 47
47 -
 48
48 -
 49
49 -
 50
50 -
51
-
52
-
53
-
54
-
55
-
56
-
57
-
58
-
59
-
60
-
61
-
62
-
63
-
64
-
65
-
66
-
67
-
68
-
69
-
70
-
71
-
72
-
73
-
74
-
75
-
76
-
77
-
78
-
79
-
80
-
81
-
82
-
83
-
84
-
85
-
86
-
87
-
88
-
89
-
90
-
91
-
92
-
93
-
94
-
95
-
96
-
97
-
98
-
99
-
100
-
101
-
102
-
103
-
104
-
105
-
106
-
107
-
108
-
109
-
110
-
111
-
112
-
113
-
114
-
115
-
116
-
117
-
118
-
119
-
120
-
121
-
122
-
123
-
124
-
125
-
126
-
127
-
128
-
129
-
130
-
131
-
132
-
133
-
134
-
135
-
136
-
137
-
138
-
139
-
140
-
141
-
142
-
143
-
144
-
145
-
146
-
147
-
148
-
149
-
150
-
151
-
152
-
153
-
154
-
155
-
156
 |
 |

38 Management Discussion
International Business Machines Corporation and Subsidiary Companies
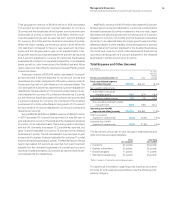
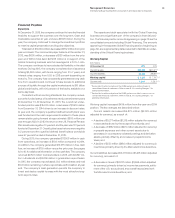
In 2015, total pre-tax retirement-related plan cost increased by
$598million compared to 2014, primarily driven by an increase in
recognized actuarial losses ($816million), lower expected return
on plan assets ($472million) and higher pension obligations related
to litigation in Spain ($85million), partially offset by lower inter-
est cost ($678million) and lower defined contribution plans cost
($115million).
As discussed in the “Operating (non-GAAP) Earnings” section
on pages18 and 19, the company characterizes certain retire-
ment-related costs as operating and others as non-operating.
Utilizing this characterization, operating retirement-related costs
in 2015 were $1,522 million, a decrease of $99million compared
to 2014, primarily driven by lower defined contribution plans cost
($115million). Non-operating costs of $1,050 million increased
$696million in 2015 compared to the prior year, driven primarily
by an increase in recognized actuarial losses ($816million), lower
expected return on plan assets ($472million), higher pension obli-
gations related to litigation in Spain ($85million), partially offset by
lower interest cost ($678million).
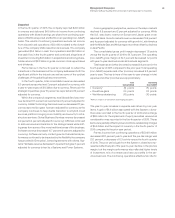
Income Taxes
The continuing operations effective tax rate for 2015 was 16.2per-
cent, a decrease of 5.0points versus the prior year, driven by the
following factors:
• The benefit resulting from the completion of the U.S. 2011–2012
tax audit, including the associated reserve redeterminations
(3.9points); and
• A benefit due to the geographic mix of pre-tax income in
2015 (3.5points); and
• A benefit due to the 2014 tax charge related to the divestiture
of the Systemx business (0.9points); partially offset by
• A reduced benefit year to year in the utilization of foreign tax
credits (2.5points); and
• The year-to-year increase in tax charges related to
intercompany payments made by foreign subsidiaries and
the intercompany licensing of certain IP (0.8points).
The continuing operations operating (non-GAAP) effective tax rate
was 17.2percent, a decrease of 3.8points versus 2014 principally
driven by the same factors described above.
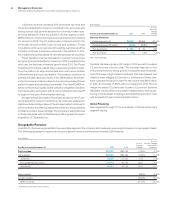
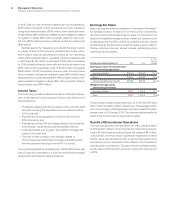
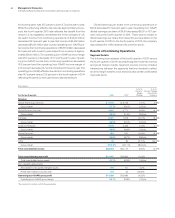
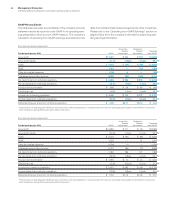
Earnings Per Share
Basic earnings per share is computed on the basis of the weight-
ed-average number of shares of common stock outstanding
during the period. Diluted earnings per share is computed on the
basis of the weighted-average number of shares of common stock
outstanding plus the effect of dilutive potential common shares
outstanding during the period using the treasury stock method.
Dilutive potential common shares include outstanding stock
options and stock awards.
For the year ended December 31: 2015 2014
Yr.-to-Yr.
Percent
Change
Earnings per share of common stock
from continuing operations
Assuming dilution $13.60 $15.59 (12.8)%
Basic $13.66 $15.68 (12.9)%
Diluted operating (non-GAAP) $14.92 $16.53 (9.7)%
Weighted-average shares
outstanding (in millions)
Assuming dilution 982.7 1,010.0 (2.7)%
Basic 978.7 1,004.3 (2.5)%
Actual shares outstanding at December31, 2015 and 2014 were
965.7million and 990.5million, respectively. The average number
of common shares outstanding assuming dilution was 27.3million
shares lower in 2015 versus 2014. The decrease was primarily the
result of the common stock repurchase program.
Results of Discontinued Operations
The loss from discontinued operations, net of tax, was $0.2billion
in 2015 and $3.7billion in 2014. The loss from discontinued opera-
tions in 2014 included a nonrecurring pre-tax charge of $4.7billion,
or $3.4billion, net of tax, which included an impairment to reflect
the fair value less estimated costs to sell the Microelectronics
business and other estimated costs related to the transaction,
including cash consideration. The discontinued operations effec-
tive tax rate in 2015 was 40.3percent compared to 30.2percent
in 2014.