IBM 2015 Annual Report Download - page 18
Download and view the complete annual report
Please find page 18 of the 2015 IBM annual report below. You can navigate through the pages in the report by either clicking on the pages listed below, or by using the keyword search tool below to find specific information within the annual report.-
 1
1 -
2
-
3
-
4
-
5
-
6
-
7
-
 8
8 -
 9
9 -
 10
10 -
 11
11 -
 12
12 -
 13
13 -
 14
14 -
 15
15 -
 16
16 -
 17
17 -
 18
18 -
 19
19 -
 20
20 -
 21
21 -
 22
22 -
 23
23 -
 24
24 -
 25
25 -
 26
26 -
 27
27 -
 28
28 -
29
-
30
-
31
-
32
-
33
-
34
-
35
-
36
-
37
-
38
-
39
-
40
-
41
-
42
-
43
-
44
-
45
-
46
-
47
-
48
-
49
-
50
-
51
-
52
-
53
-
54
-
55
-
56
-
57
-
58
-
59
-
60
-
61
-
62
-
63
-
64
-
65
-
66
-
67
-
68
-
69
-
70
-
71
-
72
-
73
-
74
-
75
-
76
-
77
-
78
-
79
-
80
-
81
-
82
-
83
-
84
-
85
-
86
-
87
-
88
-
89
-
90
-
91
-
92
-
93
-
94
-
95
-
96
-
97
-
98
-
99
-
100
-
101
-
102
-
103
-
104
-
105
-
106
-
107
-
108
-
109
-
110
-
111
-
112
-
113
-
114
-
115
-
116
-
117
-
118
-
119
-
120
-
121
-
122
-
123
-
124
-
125
-
126
-
127
-
128
-
129
-
130
-
131
-
132
-
133
-
134
-
135
-
136
-
137
-
138
-
139
-
140
-
141
-
142
-
143
-
144
-
145
-
146
-
147
-
148
-
149
-
150
-
151
-
152
-
153
-
154
-
155
-
156
 |
 |

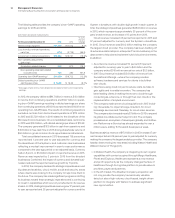
16 Financial Highlights
International Business Machines Corporation and Subsidiary Companies
($ inmillions except per share amounts)
For the year ended December 31: 2015 2014
Revenue $ 81,741 $ 92,793
Net income $ 13,190 $ 12,022
Income from continuing operations $ 13,364 $ 15,751
Operating (non-GAAP) earnings* $ 14,659 $ 16,702
Earnings per share of common stock (continuing operations)
Assuming dilution $ 13.60 $ 15.59
Basic $ 13.66 $ 15.68
Diluted operating (non-GAAP)* $ 14.92 $ 16.53
Net cash provided by operating activities $ 17,008 $ 16,868
Capital expenditures, net 3,780 3,779
Share repurchases 4,609 13,679
Cash dividends paid on common stock 4,897 4,265
Per share of common stock 5.00 4.25
At December 31: 2015 2014**
Cash, cash equivalents and marketable securities $ 8,195 $ 8,476
Total as sets 110,495 117,271
Working capital 8,235 7,797
Total de bt 39,890 40,722
Total eq uit y 14,424 12,014
Common shares outstanding (in millions) 966 991
Market capitalization $133,507 $158,920
Stock price per common share $ 137.62 $ 160.44
* See pages41 and 42 for a reconciliation of net income to operating earnings.
** Reclassified to reflect adoption of FASB guidance on deferred taxes and debt issuance costs in consolidated financial statements.