IBM 2015 Annual Report Download - page 61
Download and view the complete annual report
Please find page 61 of the 2015 IBM annual report below. You can navigate through the pages in the report by either clicking on the pages listed below, or by using the keyword search tool below to find specific information within the annual report.-
 1
1 -
2
-
3
-
4
-
5
-
6
-
7
-
8
-
9
-
10
-
11
-
12
-
13
-
14
-
15
-
16
-
17
-
18
-
19
-
20
-
21
-
22
-
23
-
24
-
25
-
26
-
27
-
28
-
29
-
30
-
31
-
32
-
33
-
34
-
35
-
36
-
37
-
38
-
39
-
40
-
41
-
42
-
43
-
44
-
45
-
46
-
47
-
48
-
49
-
50
-
 51
51 -
 52
52 -
 53
53 -
 54
54 -
 55
55 -
 56
56 -
 57
57 -
 58
58 -
 59
59 -
 60
60 -
 61
61 -
 62
62 -
 63
63 -
 64
64 -
 65
65 -
 66
66 -
 67
67 -
 68
68 -
 69
69 -
 70
70 -
 71
71 -
72
-
73
-
74
-
75
-
76
-
77
-
78
-
79
-
80
-
81
-
82
-
83
-
84
-
85
-
86
-
87
-
88
-
89
-
90
-
91
-
92
-
93
-
94
-
95
-
96
-
97
-
98
-
99
-
100
-
101
-
102
-
103
-
104
-
105
-
106
-
107
-
108
-
109
-
110
-
111
-
112
-
113
-
114
-
115
-
116
-
117
-
118
-
119
-
120
-
121
-
122
-
123
-
124
-
125
-
126
-
127
-
128
-
129
-
130
-
131
-
132
-
133
-
134
-
135
-
136
-
137
-
138
-
139
-
140
-
141
-
142
-
143
-
144
-
145
-
146
-
147
-
148
-
149
-
150
-
151
-
152
-
153
-
154
-
155
-
156
 |
 |

59
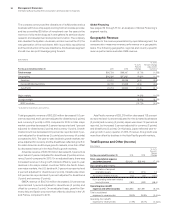
Management Discussion
International Business Machines Corporation and Subsidiary Companies
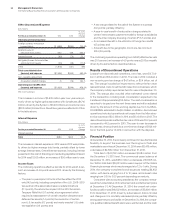
requirements related to these plans remain stable going forward at
approximately $600million per year through 2019. In 2014, the return
on the U.S. Personal Pension Plan assets was 10.1percent and the
plan was 102percent funded at December31. Overall, global asset
returns were 12.2percent and the qualified defined benefit plans
worldwide were 97percent funded at December31, 2014.
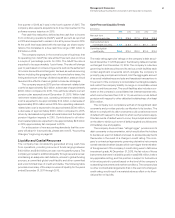
During 2014, the company generated $16,868 million in cash
from operations, a decrease of $616million compared to 2013. In
addition, the company generated $12,372 million in free cash flow,
a decrease of $2,649 million versus 2013. The company returned
$17,944 million to shareholders in 2014, with $13,679 million in gross
share repurchases and $4,265 million in dividends. In 2014, the
company repurchased 71.5million shares and had $6.3billion
remaining in share repurchase authorization at year end.
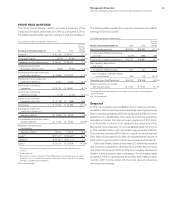
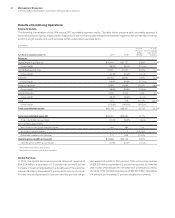
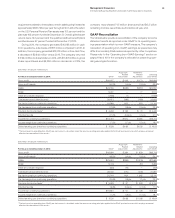
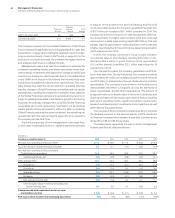
GAAP Reconciliation
The tables below provide a reconciliation of the company’s income
statement results as reported under GAAP to its operating earn-
ings presentation which is a non-GAAP measure. The company’s
calculation of operating (non-GAAP) earnings, as presented, may
differ from similarly titled measures reported by other companies.
Please refer to the “Operating (non-GAAP) Earnings” section on
pages 18 and 19 for the company’s rationale for presenting oper-
ating earnings information.
($ inmillions except per share amount)
For the year ended December 31, 2014: GAAP
Acquisition-
Related
Adjustments
Retirement-
Related
Adjustments
Operating
(non-GAAP)
Gross profi t $46,407 $ 416 $ 173 $46,996
Gross profi t margin 50.0% 0.4 pts. 0.2 pts. 50.6%
SG&A $23,180 $(385) $(257) $22,537
RD&E 5,437 — 77 5,514
Other (income) and expense (1,938) (1) — (1,939)
Total expense and other (income) 26,421 (386) (180) 25,855
Pre-tax income from continuing operations 19,986 803 353 21,142
Pre-tax margin from continuing operations 21.5% 0.9 pts. 0.4 pts. 22.8%
Provision for income taxes* $ 4,234 $ 133 $ 73 $ 4,440
Effective tax rate 21.2% (0.2) pts. 0.0 pts. 21.0%
Income from continuing operations $15,751 $ 670 $ 280 $16,702
Income margin from continuing operations 17.0% 0.7 pts. 0.3 pts. 18.0%
Diluted earnings per share from continuing operations $ 15.59 $0.66 $0.28 $ 16.53
* The tax impact on operating (non-GAAP) pre-tax income is calculated under the same accounting principles applied to the GAAP pre-tax income which employs an annual
effective tax rate method to the results.
($ inmillions except per share amount)
For the year ended December 31, 2013: GAAP
Acquisition-
Related
Adjustments
Retirement-
Related
Adjustments
Operating
(non-GAAP)
Gross profi t $48,684 $ 394 $ 629 $49,706
Gross profi t margin 49.5% 0.4 pts. 0.6 pts. 50.5%
SG&A $23,451 $(394) $ (376) $22,680
RD&E 5,743 — (57) 5,686
Other (income) and expense (333) (16) — (349)
Total expense and other (income) 28,440 (410) (433) 27,597
Pre-tax income from continuing operations 20,244 804 1,062 22,110
Pre-tax margin from continuing operations 20.6% 0.8 pts. 1.1 pts. 22.5%
Provision for income taxes* $ 3,363 $ 57 $ 333 $ 3,753
Effective tax rate 16.6% (0.4) pts. 0.7 pts. 17.0%
Income from continuing operations $16,881 $ 747 $ 729 $18,356
Income margin from continuing operations 17.2% 0.8 pts. 0.7 pts. 18.7%
Diluted earnings per share from continuing operations $ 15.30 $0.68 $ 0.66 $ 16.64
* The tax impact on operating (non-GAAP) pre-tax income is calculated under the same accounting principles applied to the GAAP pre-tax income which employs an annual
effective tax rate method to the results.