IBM 2015 Annual Report Download - page 36
Download and view the complete annual report
Please find page 36 of the 2015 IBM annual report below. You can navigate through the pages in the report by either clicking on the pages listed below, or by using the keyword search tool below to find specific information within the annual report.-
 1
1 -
2
-
3
-
4
-
5
-
6
-
7
-
8
-
9
-
10
-
11
-
12
-
13
-
14
-
15
-
16
-
17
-
18
-
19
-
20
-
21
-
22
-
23
-
24
-
25
-
 26
26 -
 27
27 -
 28
28 -
 29
29 -
 30
30 -
 31
31 -
 32
32 -
 33
33 -
 34
34 -
 35
35 -
 36
36 -
 37
37 -
 38
38 -
 39
39 -
 40
40 -
 41
41 -
 42
42 -
 43
43 -
 44
44 -
 45
45 -
 46
46 -
47
-
48
-
49
-
50
-
51
-
52
-
53
-
54
-
55
-
56
-
57
-
58
-
59
-
60
-
61
-
62
-
63
-
64
-
65
-
66
-
67
-
68
-
69
-
70
-
71
-
72
-
73
-
74
-
75
-
76
-
77
-
78
-
79
-
80
-
81
-
82
-
83
-
84
-
85
-
86
-
87
-
88
-
89
-
90
-
91
-
92
-
93
-
94
-
95
-
96
-
97
-
98
-
99
-
100
-
101
-
102
-
103
-
104
-
105
-
106
-
107
-
108
-
109
-
110
-
111
-
112
-
113
-
114
-
115
-
116
-
117
-
118
-
119
-
120
-
121
-
122
-
123
-
124
-
125
-
126
-
127
-
128
-
129
-
130
-
131
-
132
-
133
-
134
-
135
-
136
-
137
-
138
-
139
-
140
-
141
-
142
-
143
-
144
-
145
-
146
-
147
-
148
-
149
-
150
-
151
-
152
-
153
-
154
-
155
-
156
 |
 |

34 Management Discussion
International Business Machines Corporation and Subsidiary Companies
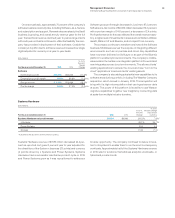
zSystems revenue increased 28.1percent as reported and
35percent adjusted for currency compared to the prior year, with
strong double-digit growth adjusted for currency in each quar-
ter since the launch of the z13 system in the first quarter of 2015.
MIPS (millions of instructions per second) shipments increased
33percent in 2015. The z13 system was contemporized for the
workloads around mobile, hybrid cloud and analytics. These
innovations continue to resonate with existing customers and the
company continues to add new customers to the platform. In 2015,
the zSystems business added 50 new clients across 25 countries.
Power Systems revenue decreased 0.4percent as reported,
but grew 4percent adjusted for currency in 2015 compared to the
prior year, the first year of revenue growth since 2011. The Power
Systems performance reflects the progress being made to trans-
form the platform to align around data and cloud opportunities,
while embracing an open ecosystem. The company continues to
address the high value opportunity in the UNIX market. Simultane-
ously, the company has introduced a low-end Linux-based Power
system to capture the growing Linux market. The OpenPOWER ini-
tiative continues to progress as the company integrates innovation
from the broader ecosystem with its own products and licenses IP
to support third-party Power-based offerings.
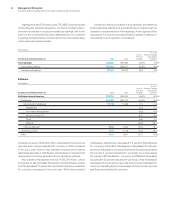
Storage revenue decreased 11.9percent as reported and 7per-
cent adjusted for currency in 2015 driven by continued weakness in
traditional disk and tape. Value in the storage market continues to
shift to software and offering requirements that are driving demand
for flash and object-based storage. The company is well positioned
in these new areas with its FlashSystems offerings and the recent
acquisition of Cleversafe, Inc.
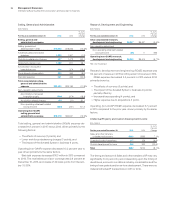
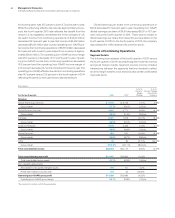
($ inmillions)
For the year ended December 31: 2015 2014
Yr.-to-Yr.
Percent/
Margin
Change
Systems Hardware
External gross profi t $3,535 $3,945 (10.4)%
External gross profi t margin 46.6% 39.5% 7.2 pts.
Pre-tax income $ 604 $ 34 NM
Pre-tax margin 7.5% 0.3% 7.2 pts.
NM—Not meaningful
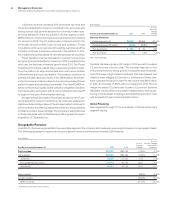
Systems Hardware gross profit margin of 46.6percent increased
7.2points versus the prior year. The increase was due to mix
(11.8points) driven by strong growth in zSystems and the divesti-
ture of the lower margin Systemx business. This improvement was
offset by lower margins (4.6points) in zSystems and Power Sys-
tems compared to the prior year. Pre-tax income was $604million
in 2015, an increase of $570million compared to 2014. Pre-tax
margin increased 7.2points year to year to 7.5percent. Systems
Hardware results reflect a successful transformation and reposi-
tioning of the business including a solid mainframe product cycle
and successful Power Systems transformation.
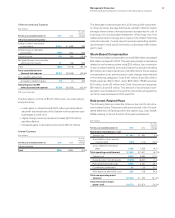
Global Financing
See pages69 through 73 for an analysis of Global Financing’s
segment results.
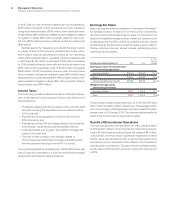
Geographic Revenue
In addition to the revenue presentation by reportable segment, the company also measures revenue performance on a geographic basis.
The following geographic, regional and country-specific revenue performance excludes OEM revenue.
($ inmillions)
For the year ended December 31: 2015 2014
Yr.-to-Yr.
Percent
Change
Yr.-to-Yr.
Percent Change
Adjusted for
Currency*
Total revenue $81,741 $92,793 (11.9)% (1.2)%
Geographies $81,430 $92,326 (11.8)% (1.1)%
Americas 38,486 41,410 (7.1) (1.8)
Europe/Middle East/Africa 26,073 30,700 (15.1) 0.3
Asia Pacifi c 16,871 20,216 (16.5) (1.7)
Major markets (9.9)% (0.5)%
Growth markets (18.4)% (3.1)%
BRIC countries (27.1)% (10.1)%
* Adjusted for divestitures and currency.