IBM 2015 Annual Report Download - page 151
Download and view the complete annual report
Please find page 151 of the 2015 IBM annual report below. You can navigate through the pages in the report by either clicking on the pages listed below, or by using the keyword search tool below to find specific information within the annual report.-
 1
1 -
2
-
3
-
4
-
5
-
6
-
7
-
8
-
9
-
10
-
11
-
12
-
13
-
14
-
15
-
16
-
17
-
18
-
19
-
20
-
21
-
22
-
23
-
24
-
25
-
26
-
27
-
28
-
29
-
30
-
31
-
32
-
33
-
34
-
35
-
36
-
37
-
38
-
39
-
40
-
41
-
42
-
43
-
44
-
45
-
46
-
47
-
48
-
49
-
50
-
51
-
52
-
53
-
54
-
55
-
56
-
57
-
58
-
59
-
60
-
61
-
62
-
63
-
64
-
65
-
66
-
67
-
68
-
69
-
70
-
71
-
72
-
73
-
74
-
75
-
76
-
77
-
78
-
79
-
80
-
81
-
82
-
83
-
84
-
85
-
86
-
87
-
88
-
89
-
90
-
91
-
92
-
93
-
94
-
95
-
96
-
97
-
98
-
99
-
100
-
101
-
102
-
103
-
104
-
105
-
106
-
107
-
108
-
109
-
110
-
111
-
112
-
113
-
114
-
115
-
116
-
117
-
118
-
119
-
120
-
121
-
122
-
123
-
124
-
125
-
126
-
127
-
128
-
129
-
130
-
131
-
132
-
133
-
134
-
135
-
136
-
137
-
138
-
139
-
140
-
 141
141 -
 142
142 -
 143
143 -
 144
144 -
 145
145 -
 146
146 -
 147
147 -
 148
148 -
 149
149 -
 150
150 -
 151
151 -
 152
152 -
 153
153 -
 154
154 -
 155
155 -
 156
156
 |
 |

149
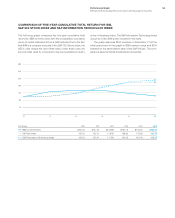
Performance Graph
International Business Machines Corporation and Subsidiary Companies
COMPARISON OF FIVE-YEAR CUMULATIVE TOTAL RETURN FOR IBM,
S&P 500 STOCK INDEX AND S&P INFORMATION TECHNOLOGY INDEX
The following graph compares the five-year cumulative total
returns for IBM common stock with the comparable cumulative
return of certain Standard & Poor’s (S&P) indices. Due to the fact
that IBM is a company included in the S&P 500 Stock Index, the
SEC’s rules require the use of that index. Under those rules, the
second index used for comparison may be a published industry
(U.S. Dollar) 2010 2011 2012 2013 2014 2015
IBM Common Stock $100.00 $127.42 $134.98 $134.73 $118.04 $104.57
S & P 500 Index 100.00 102.11 118.45 156.82 178.29 180.75
S & P Information Technology Index 100.00 102.41 117.59 151.03 181.40 192.15
240
280
40
80
200
160
120
10 11 12 13 14 15
or line-of-business index. The S&P Information Technology Index
is such an index. IBM is also included in this index.
The graph assumes $100 invested on December31 (of the
initial year shown in the graph) in IBM common stock and $100
invested on the same date in each of the S&P indices. The com-
parisons assume that all dividends are reinvested.