IBM 2015 Annual Report Download - page 21
Download and view the complete annual report
Please find page 21 of the 2015 IBM annual report below. You can navigate through the pages in the report by either clicking on the pages listed below, or by using the keyword search tool below to find specific information within the annual report.
19
Management Discussion
International Business Machines Corporation and Subsidiary Companies
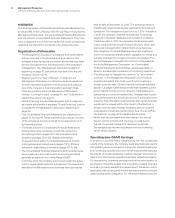
company characterizes certain items as operating and others as
non-operating. The company includes defined benefit plan and
nonpension postretirement benefit plan service cost, amortization
of prior service cost and the cost of defined contribution plans
in operating earnings. Non-operating retirement-related cost
includes defined benefit plan and nonpension postretirement
benefit plan interest cost, expected return on plan assets, amor-
tized actuarial gains/losses, the impacts of any plan curtailments/
settlements and multi-employer plan costs, pension insolvency
costs and other costs. Non-operating retirement-related costs are
primarily related to changes in pension plan assets and liabilities
which are tied to financial market performance and the company
considers these costs to be outside the operational performance
of the business.
Overall, the company believes that providing investors with a
view of operating earnings as described above provides increased
transparency and clarity into both the operational results of the
business and the performance of the company’s pension plans;
improves visibility to management decisions and their impacts on
operational performance; enables better comparison to peer com-
panies; and allows the company to provide a long-term strategic
view of the business going forward. The company’s reportable
segment financial results reflect operating earnings from continu-
ing operations, consistent with the company’s management and
measurement system.
FORWARD-LOOKING AND
CAUTIONARY STATEMENTS
Certain statements contained in this Annual Report may consti-
tute forward-looking statements within the meaning of the Private
Secur ities Litigation Reform Act of 1995. Any forward-looking
statement in this Annual Report speaks only as of the date on
which it is made; the company assumes no obligation to update
or revise any such statements. Forward-looking statements are
based on the company’s current assumptions regarding future
business and financial performance; these statements, by their
nature, address matters that are uncertain to different degrees.
Forward-looking statements involve a number of risks, uncer-
tainties and other factors that could cause actual results to be
materially different, as discussed more fully elsewhere in this
Annual Report and in the company’s filings with the Securities
and Exchange Commission (SEC), including the company’s 2015
Form 10-K filed on February23, 2016.
MANAGEMENT DISCUSSION SNAPSHOT
($ and shares inmillions except per share amounts)
For the year ended December 31: 2015 2014
Yr.-to-Yr.
Percent/
Margin
Change
Revenue $ 81,741 $ 92,793 (11.9)%*
Gross profi t margin 49.8% 50.0% (0.2) pts.
Total expense and other (income) $ 24,740 $ 26,421 (6.4)%
Total expense and other
(income)-to-revenue ratio 30.3% 28.5% 1.8 pts.
Income from continuing
operations before income taxes $ 15,945 $ 19,986 (20.2)%
Provision for income taxes from
continuing operations $ 2,581 $ 4,234 (39.1)%
Income from continuing
operations $ 13,364 $ 15,751 (15.2)%
Income from continuing
operations margin 16.3% 17.0% (0.6) pts.
Loss from discontinued
operations, net of tax $ (174) $ (3,729) (95.3)%
Net income $ 13,190 $ 12,022 9.7%
Earnings per share from
continuing operations:
Assuming dilution $ 13.60 $ 15.59 (12.8)%
Consolidated earnings per share—
assuming dilution $ 13.42 $ 11.90 12.8%
Weighted-average shares
outstanding
Assuming dilution 982.7 1,010.0 (2.7)%
Assets** $110,495 $117,271+(5.8)%
Liabilities** $ 96,071 $105,257+(8.7)%
Equity** $ 14,424 $ 12,014 20.1%
* (4.1)percent adjusted for currency; (1.2)percent adjusted for divestitures and
currency.
** At December 31.
+
Reclassified to reflect adoption of the FASB guidance on deferred taxes and debt
issuance costs in consolidated financial statements. Refer to noteB, “Accounting
Changes,” for additional information.


