IBM 2015 Annual Report Download - page 108
Download and view the complete annual report
Please find page 108 of the 2015 IBM annual report below. You can navigate through the pages in the report by either clicking on the pages listed below, or by using the keyword search tool below to find specific information within the annual report.-
 1
1 -
2
-
3
-
4
-
5
-
6
-
7
-
8
-
9
-
10
-
11
-
12
-
13
-
14
-
15
-
16
-
17
-
18
-
19
-
20
-
21
-
22
-
23
-
24
-
25
-
26
-
27
-
28
-
29
-
30
-
31
-
32
-
33
-
34
-
35
-
36
-
37
-
38
-
39
-
40
-
41
-
42
-
43
-
44
-
45
-
46
-
47
-
48
-
49
-
50
-
51
-
52
-
53
-
54
-
55
-
56
-
57
-
58
-
59
-
60
-
61
-
62
-
63
-
64
-
65
-
66
-
67
-
68
-
69
-
70
-
71
-
72
-
73
-
74
-
75
-
76
-
77
-
78
-
79
-
80
-
81
-
82
-
83
-
84
-
85
-
86
-
87
-
88
-
89
-
90
-
91
-
92
-
93
-
94
-
95
-
96
-
97
-
 98
98 -
 99
99 -
 100
100 -
 101
101 -
 102
102 -
 103
103 -
 104
104 -
 105
105 -
 106
106 -
 107
107 -
 108
108 -
 109
109 -
 110
110 -
 111
111 -
 112
112 -
 113
113 -
 114
114 -
 115
115 -
 116
116 -
 117
117 -
 118
118 -
119
-
120
-
121
-
122
-
123
-
124
-
125
-
126
-
127
-
128
-
129
-
130
-
131
-
132
-
133
-
134
-
135
-
136
-
137
-
138
-
139
-
140
-
141
-
142
-
143
-
144
-
145
-
146
-
147
-
148
-
149
-
150
-
151
-
152
-
153
-
154
-
155
-
156
 |
 |

Notes to Consolidated Financial Statements
International Business Machines Corporation and Subsidiary Companies
106
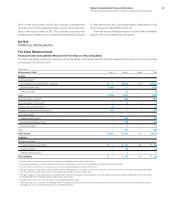
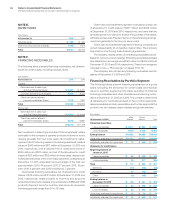
NOTEE.
INVENTORIES
($ inmillions)
At December 31: 2015 2014
Finished goods $ 352 $ 430
Work in process and raw materials 1,199 1,674
Total $1,551 $2,103
NOTEF.
FINANCING RECEIVABLES
The following table presents financing receivables, net of allow-
ances for credit losses, including residual values.
($ inmillions)
At December 31: 2015 2014
Current
Net investment in sales-type
and direct fi nancing leases $ 3,057 $ 3,781
Commercial fi nancing receivables 8,948 8,423
Client loan and installment
payment receivables (loans) 7,015 7,631
Total $19,020 $19,835
Noncurrent
Net investment in sales-type
and direct fi nancing leases $ 4,501 $ 4,449
Client loan and installment
payment receivables (loans) 5,512 6,660
Total $10,013 $11,109
Net investment in sales-type and direct financing leases relates
principally to the company’s systems products and are for terms
ranging generally from two to six years. Net investment in sales-
type and direct financing leases includes unguaranteed residual
values of $645million and $671million at December31, 2015 and
2014, respectively, and is reflected net of unearned income of
$536million and $517million, and net of the allowance for credit
losses of $213million and $165million at those dates, respectively.
Scheduled maturities of minimum lease payments outstanding at
December31, 2015, expressed as a percentage of the total, are
approximately: 2016, 44percent; 2017, 27percent; 2018, 18per-
cent; 2019, 8percent; and 2020 and beyond, 3percent.
Commercial financing receivables, net of allowance for credit
losses of $19million and $17million at December31, 2015 and
2014, respectively, relate primarily to inventory and accounts
receivable financing for dealers and remarketers of IBM and OEM
products. Payment terms for inventory and accounts receivable
financing generally range from 30 to 90 days.
Client loan and installment payment receivables (loans), net
of allowance for credit losses of $377million and $396million
at December31, 2015 and 2014, respectively, are loans that are
provided primarily to clients to finance the purchase of hardware,
software and services. Payment terms on these financing arrange-
ments are generally for terms up to seven years.
Client loan and installment payment financing contracts are
priced independently at competitive market rates. The company
has a history of enforcing these financing agreements.
The company utilizes certain of its financing receivables as col-
lateral for nonrecourse borrowings. Financing receivables pledged
as collateral for borrowings were $545million and $642million at
December31, 2015 and 2014, respectively. These borrowings are
included in noteJ, “Borrowings,” on pages 111 to 113.
The company did not have any financing receivables held for
sale as of December31, 2015 and 2014.
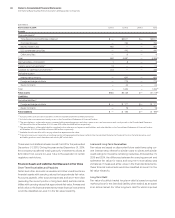
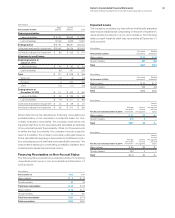
Financing Receivables by Portfolio Segment
The following tables present financing receivables on a gross
basis, excluding the allowance for credit losses and residual
value, by portfolio segment and by class, excluding commercial
financing receivables and other miscellaneous financing receiv-
ables at December31, 2015 and 2014. The company determines
its allowance for credit losses based on two portfolio segments:
lease receivables and loan receivables, and further segments the
portfolio into two classes: major markets and growth markets.
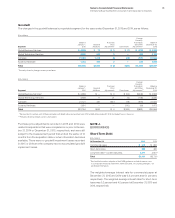
($ inmillions)
At December 31, 2015:
Major
Markets
Growth
Markets Total
Financing receivables
Lease receivables $ 5,517 $1,524 $ 7,041
Loan receivables 9,739 3,165 12,904
Ending balance $15,256 $4,689 $19,945
Collectively evaluated for impairment $15,180 $4,227 $19,406
Individually evaluated for impairment $ 76 $ 462 $ 539
Allowance for credit losses
Beginning balance at
January1, 2015
Lease receivables $ 32 $ 133 $ 165
Loan receivables 79 317 396
Total $ 111 $ 450 $ 561
Write-offs (14) (48) (62)
Provision 20 122 141
Other (8) (43) (51)
Ending balance at
December 31, 2015 $ 109 $ 481 $ 590
Lease receivables $ 25 $ 188 $ 213
Loan receivables $ 83 $ 293 $ 377
Collectively evaluated for impairment $ 43 $ 36 $ 79
Individually evaluated for impairment $ 65 $ 445 $ 511